
Tomorrow’s Uranium Scarcity is Being Allocated Today
This report is for informational purposes only and is not investment advice or an offer to buy or sell any security. The firm and its affiliates may hold positions in the securities discussed. Opinions are subject to change and any reliance is at your own risk. Do your own research.
———
Nuclear energy is becoming indispensable just as the fuel system beneath it begins to tighten.
Electricity demand is rising, grids need dependable power, and energy security has returned to the centre of national policy. Governments are extending reactor lives, restarting closed plants, and planning new fleets on a scale not seen in decades.
The uranium market underpinning this revival, however, was built for a world of stagnant nuclear demand.
It is increasingly global in reach but concentrated at its foundations. Kazakhstan produces more than 40% of the world’s mined uranium, while Russia controls more than 40% of global enrichment capacity. China holds a different kind of leverage: it does not dominate a comparable stage of the fuel cycle, but it is the world’s largest and most coordinated uranium buyer, securing material today for what will be the world's largest reactor fleet.
This is already visible Figure 1.
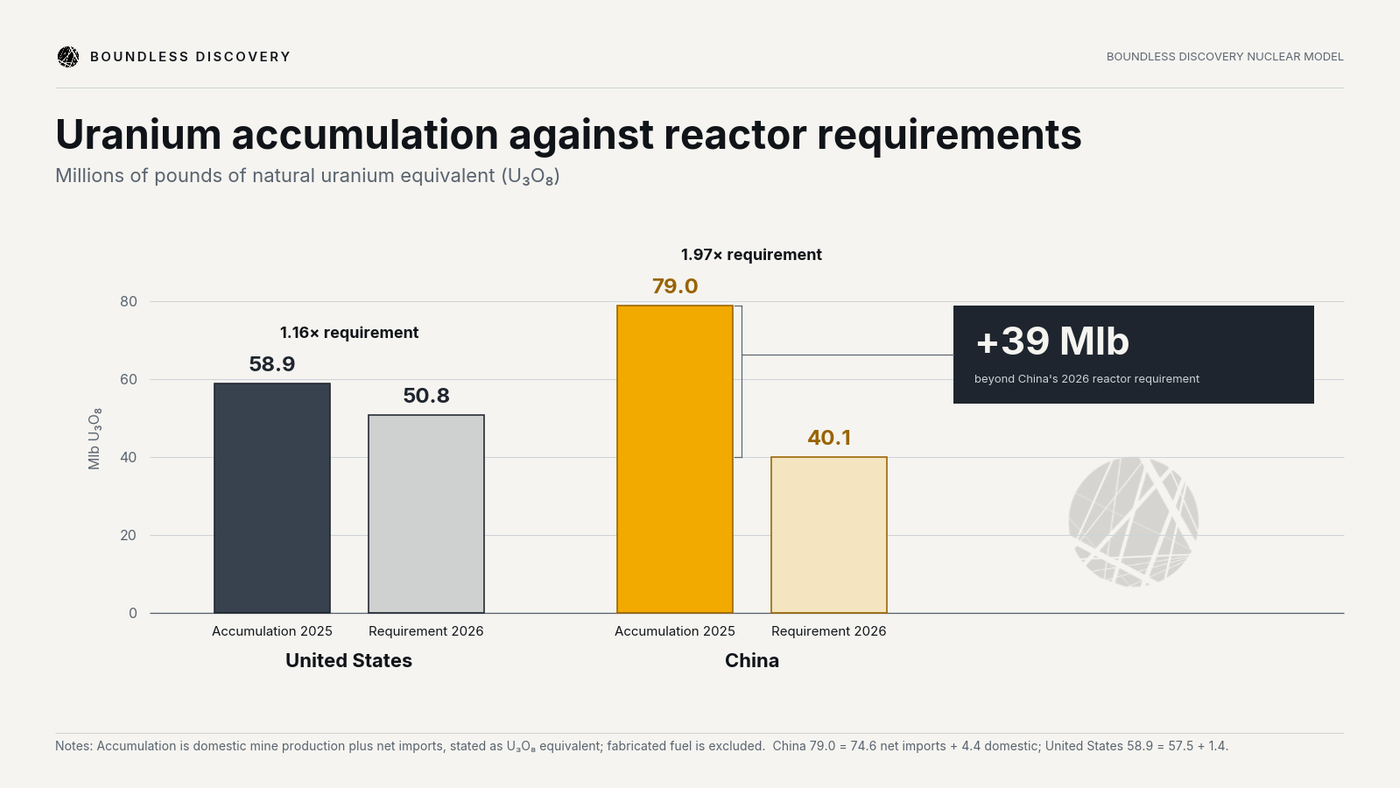
In 2025, US net uranium imports plus domestic production totalled 58.9 million pounds (Mlb) of natural uranium-equivalent (U₃O₈), against 50.8 Mlb of reactor requirements in 2026. China accumulated 79 Mlb - almost twice the 40.1 Mlb its reactors require in 2026. While the United States bought for the fleet it operates, China appears to be procuring against the level of demand it will hit next decade.
Historically, this dynamic would not have mattered. Mine output and abundant sources of secondary supply kept uranium plentiful, while an integrated global fuel market made supply broadly interchangeable between buyers. This is no longer the case. Russia and China now control mine and fuel-cycle capacity the West increasingly cannot access, while Eastern buyers can still compete for the same open supply pool which Western utilities depend on.
The market is becoming a one-way membrane: Eastern sovereign systems can draw on captive production while continuing to compete for merchant pounds; Western buyers cannot ordinarily access Eastern-captive supply in return.
This asymmetry affects all Western buyers, but the immediate exposure is greatest in the United States. US utilities operate the world’s largest nuclear fleet and procure independently rather than against a coordinated national supply position.
Nuclear fuel is bought years before it is used. In a well-supplied market, buyers can afford to contract late. In a tightening one, the timing of procurement determines who secures supply and who pays the price of a shortage.
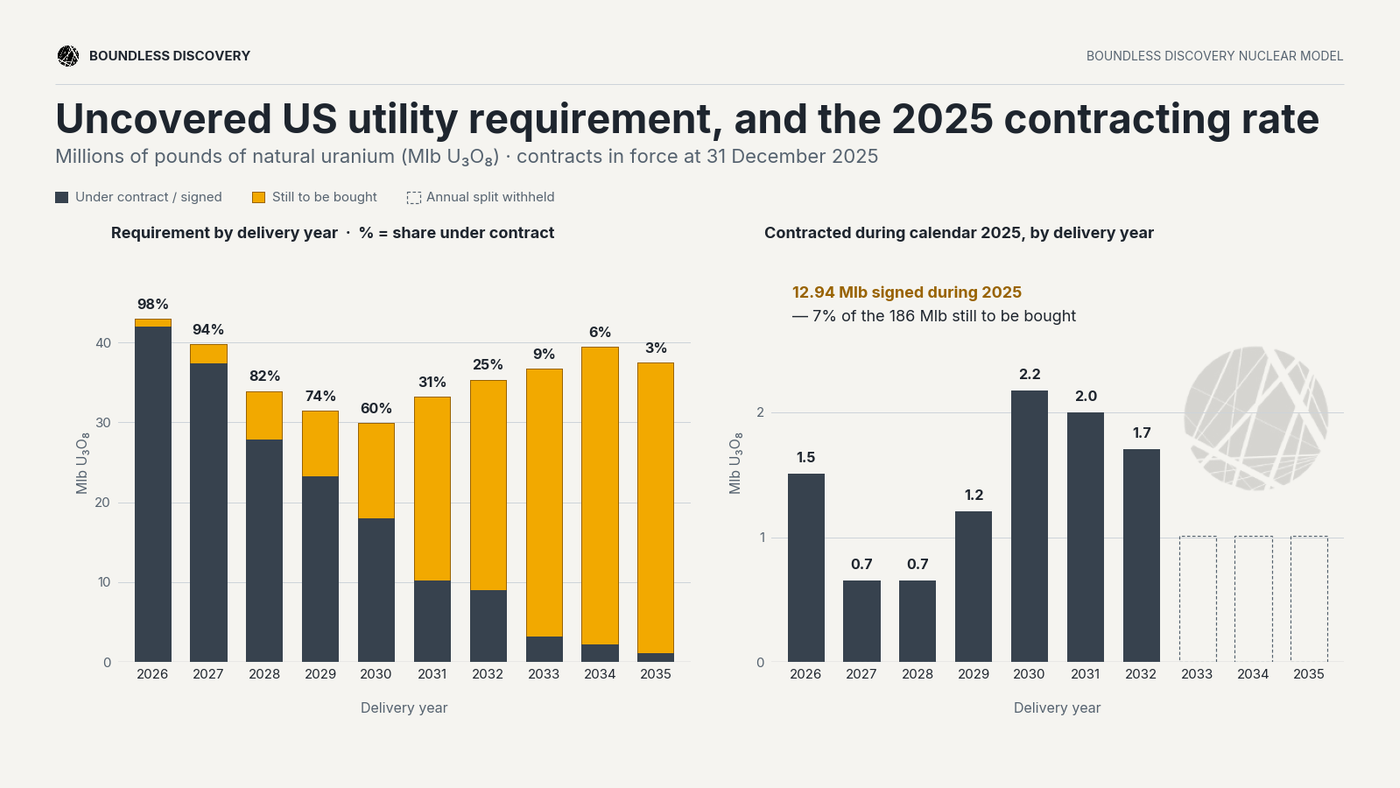
The divergence is clearest in the US utility contract book. As of December 2025, near-term requirements are largely covered, but coverage drops off a cliff down the line: by 2030, 40% of anticipated demand is uncovered; by 2031, almost 70%; and by 2035, virtually all of it. Across 2026–35, US utilities still need to procure more than half their anticipated requirements (Figure 2).
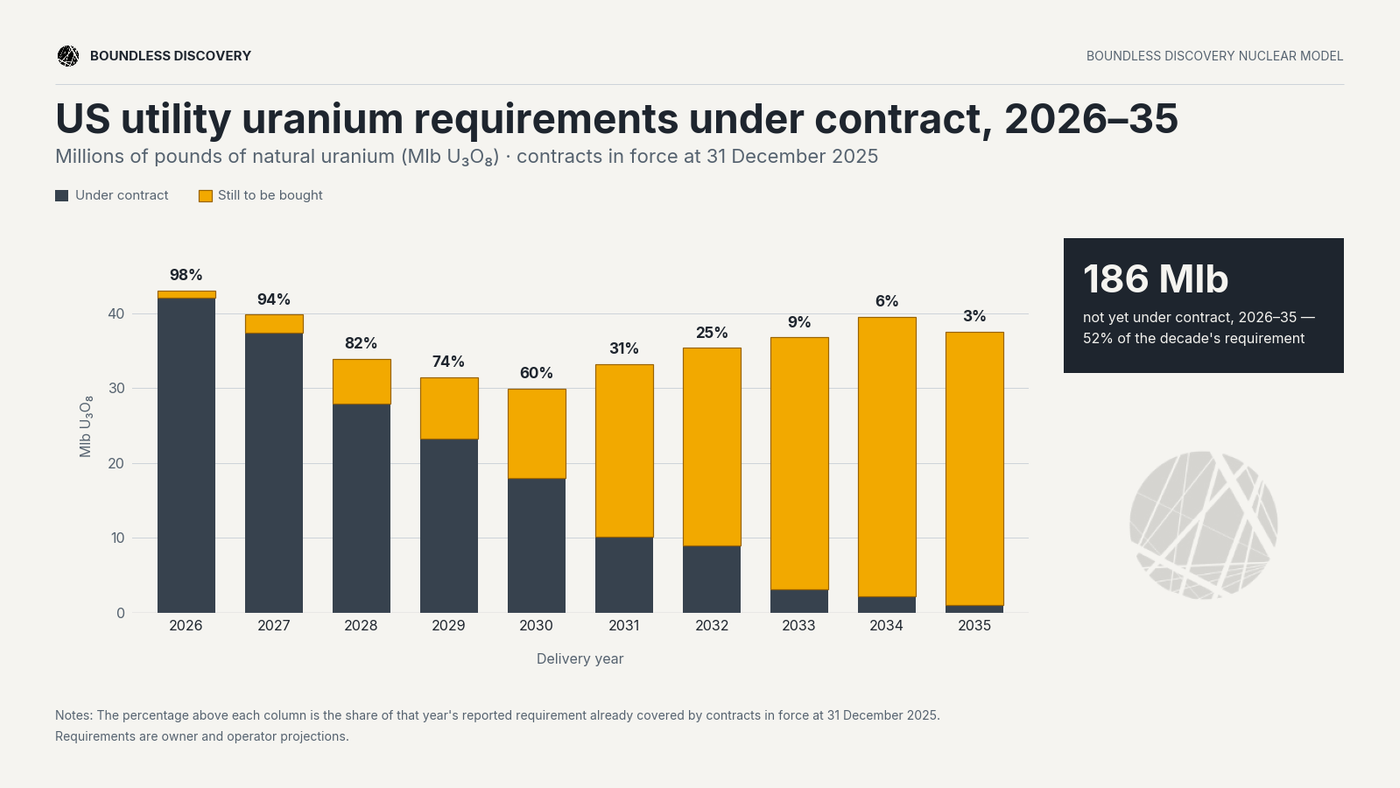
Most uranium forecasts ask how much will be produced. We ask an additional question: which pounds will still be available when each buyer comes to contract?
Eastern sovereign buyers are securing tomorrow’s supply today. Western utilities will have to compete for what remains and rely increasingly on mines that have not yet been built. The US utility fleet is the most exposed: its contract coverage falls away just as the contestable supply pool tightens.
This report shows how that happens - and why US utilities risk becoming the market’s residual buyer.
___
Part 1: The Aggregate Balance has No Margin
Before adjusting for differences in access, the aggregate market is already very tight. Boundless Discovery's 2026–35 base case sees reactor demand hitting 2,264 Mlb of natural uranium (U₃O₈) and 'Firm' mines (currently operating) supplying 1,858 Mlb; 'Probable' (under construction or with a committed final investment decision) mines add a further 265 Mlb, leaving a 141 Mlb primary deficit.
Secondary supplies (addressed later) can bridge part of that gap, but the near-balance is not evidence of comfort and access to secondary supply is anything but uniform. Even holding the deficit at 141 Mlb depends on Probable mines arriving on schedule and no material increase in requirements from sovereign stockpiling, utility inventory accumulation or the more speculative reactor builds. Our base case is closer to a floor than what we foresee to be likely.
Part I explains why future reactor demand today is increasingly certain, while future mine supply remains highly conditional.
1.1 Demand is Scheduled
Future uranium demand is unusually visible. Uranium for a reactor's initial core must be procured long before it operates, and reloads recur for decades after. Once a unit enters construction, its future requirement acquires both a quantity and an increasingly firm schedule.
Our base case builds this reactor-by-reactor: modelling existing reactors, the initial-core demand for new units, plus recurring reload demand across the global fleet. We also adjust for each reactor’s capacity factor (the percentage of time it runs at full power) so fuel demand tracks expected reactor output rather than maximum capacity.
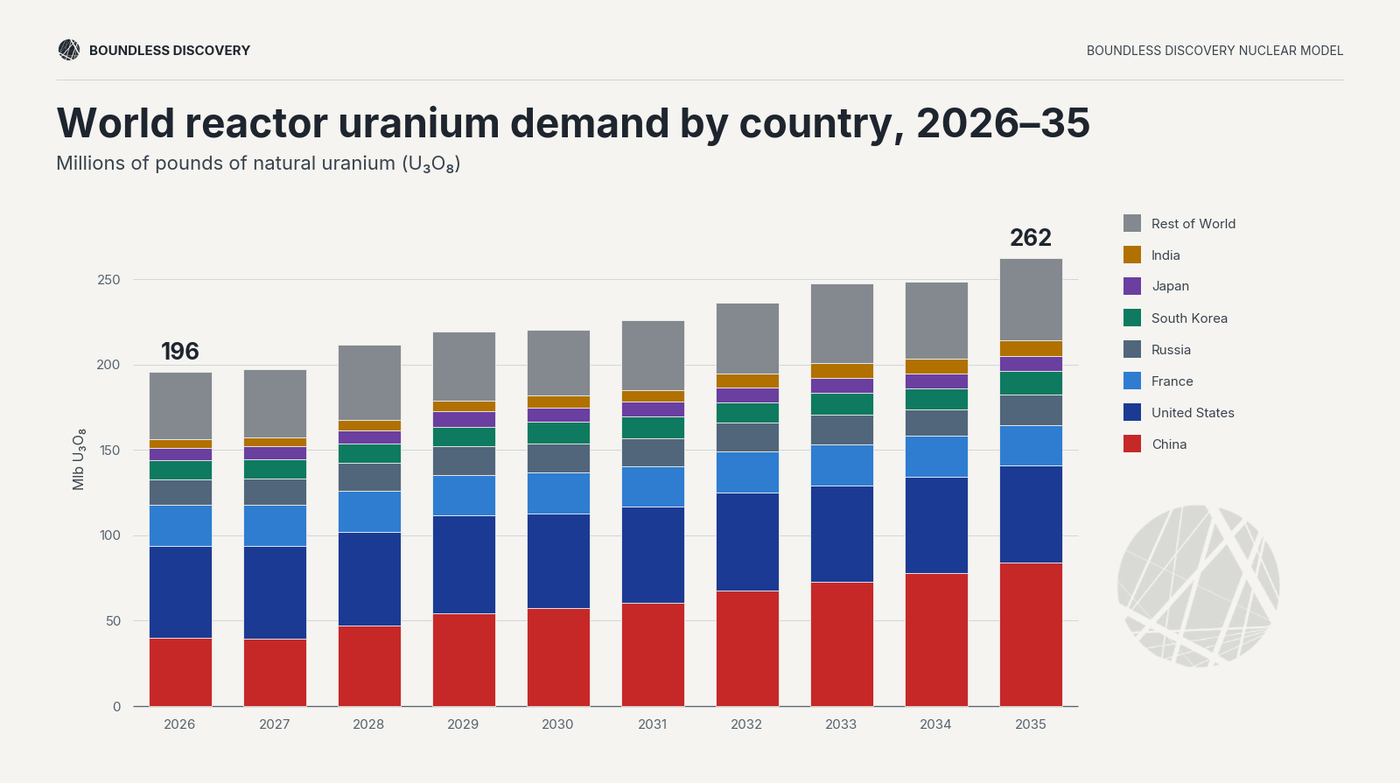
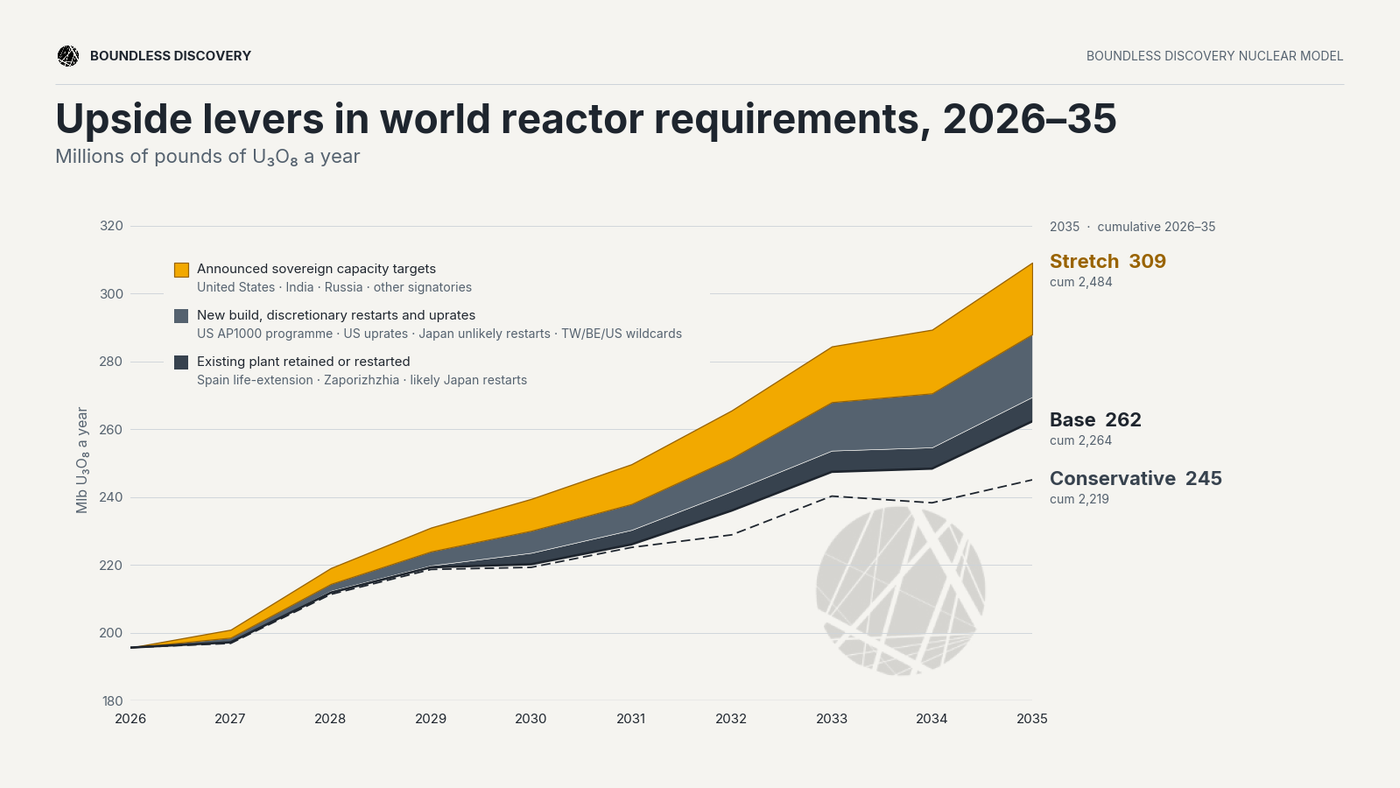
Demand climbs by roughly a third across the decade to 262 Mlb/year, 2,264 Mlb cumulative (Figure 3). This excludes less-certain construction, restarts, life extensions, national targets, and an increasingly large list of Small Modular Reactors (SMRs) that could arrive in the 2030s. It also counts reactor consumption only: no utility inventory rebuild, no sovereign stockpiling, or financial buyers (accumulation by trusts and hedge funds).
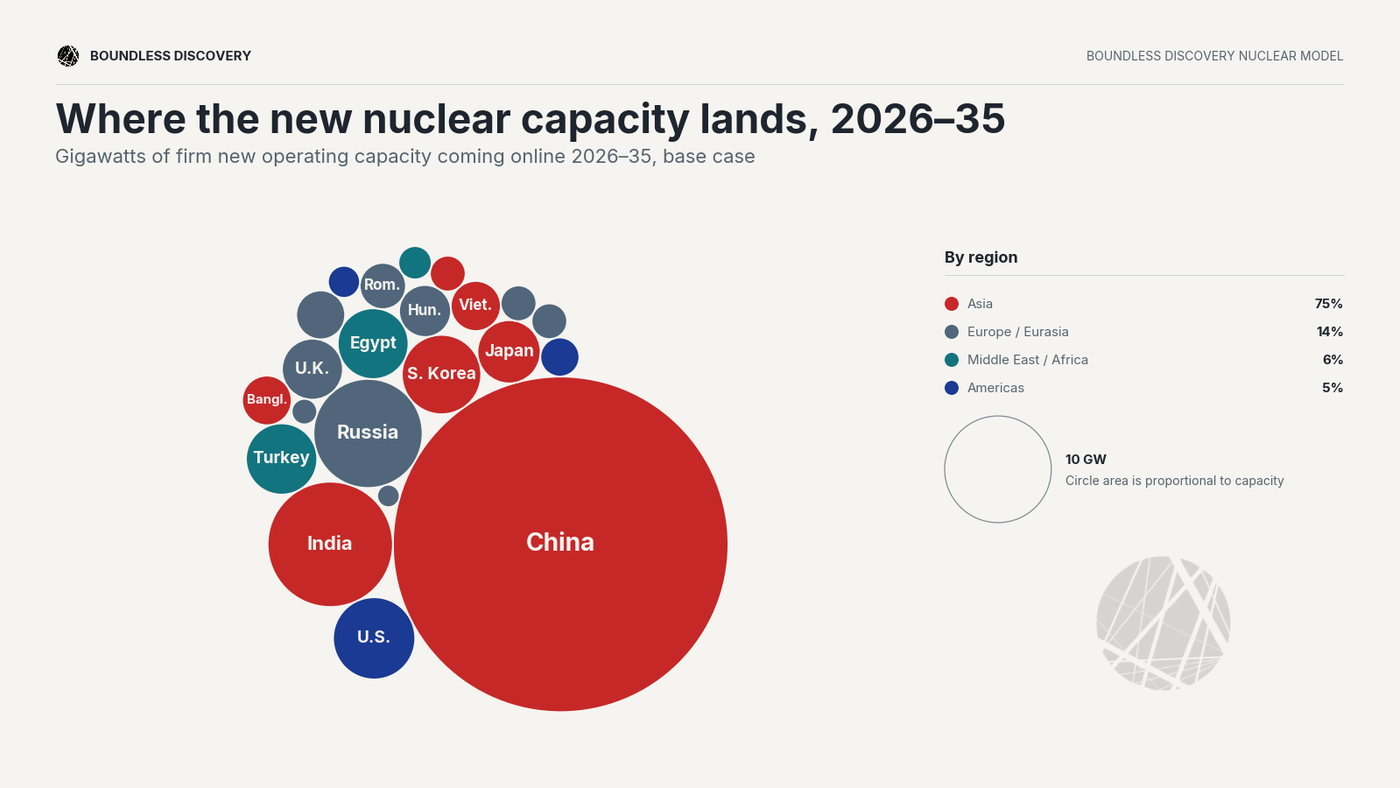
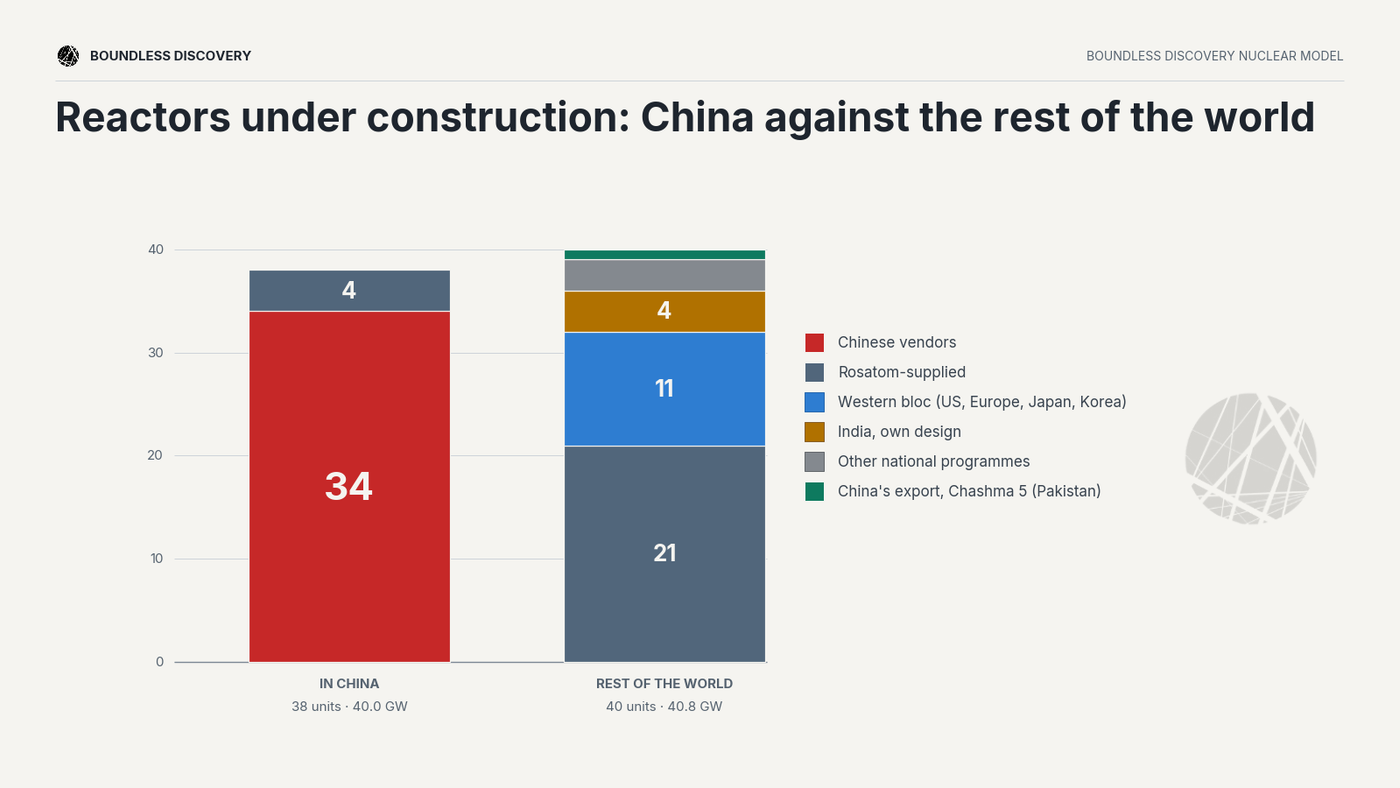
The growth is not evenly spread. Behind it, we project 162 new reactors adding 153 GW – 112 of them gigawatt-scale – alongside restarts and uprates. Set against roughly 17 GW of reactor retirements, the fleet generating electricity today of 376 GW grows to 521 GW by 2035: a 145 GW net increase, up 38%. China and India account for over 100 of those new reactors and 70% of the new-build capacity (Figure 4), with China the clear centre of the build-out (Figure 5).
What matters is not just the scale of the buildout but the reliability of the timetable. China's serial units now run from first concrete to commercial operation in 5.7 years, against 10.4 for US AP1000 reactors and 18.1 years for Europe's EPRs (Figure 6).
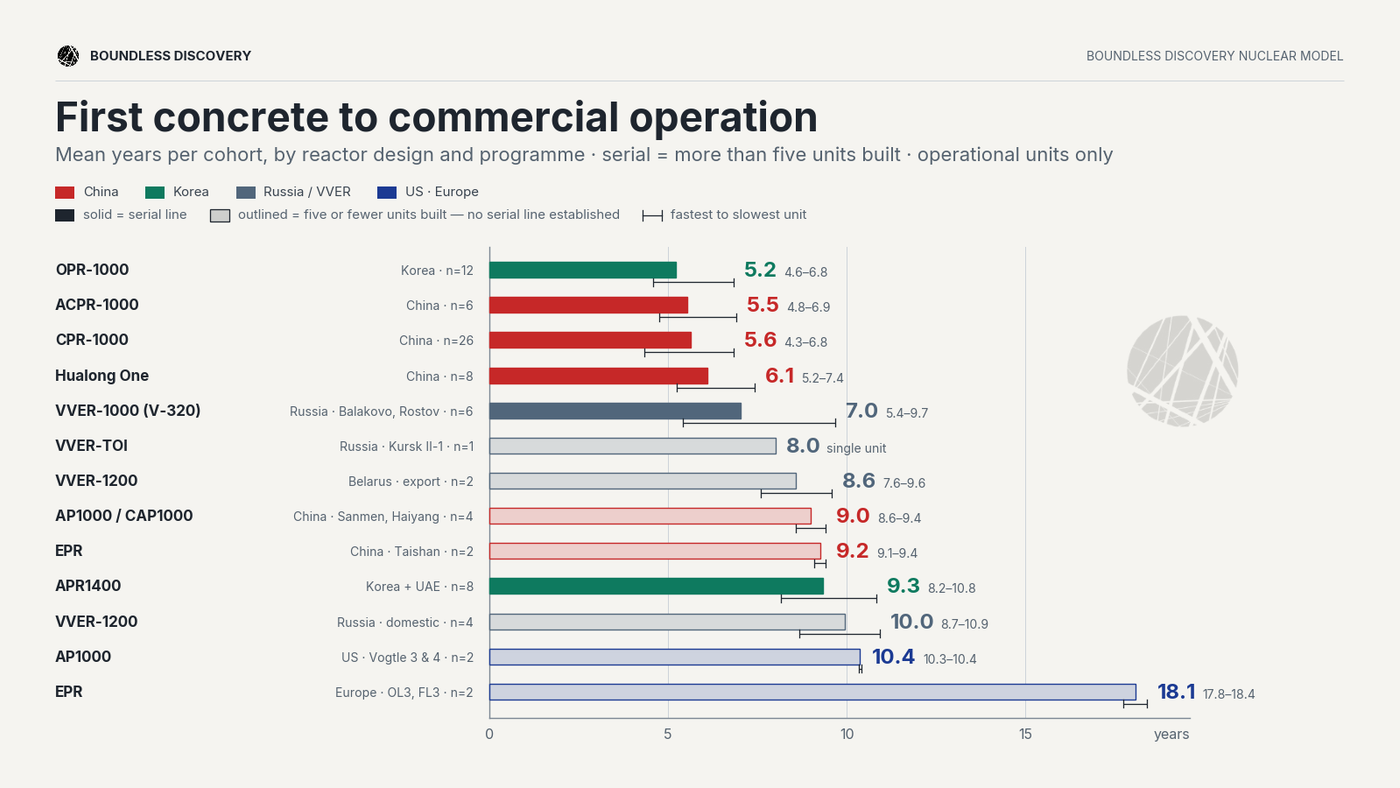
This is not purely a geographic comparison. Chinese first-of-a-kind projects have themselves taken more than nine years. What changed was repetition and standardisation.
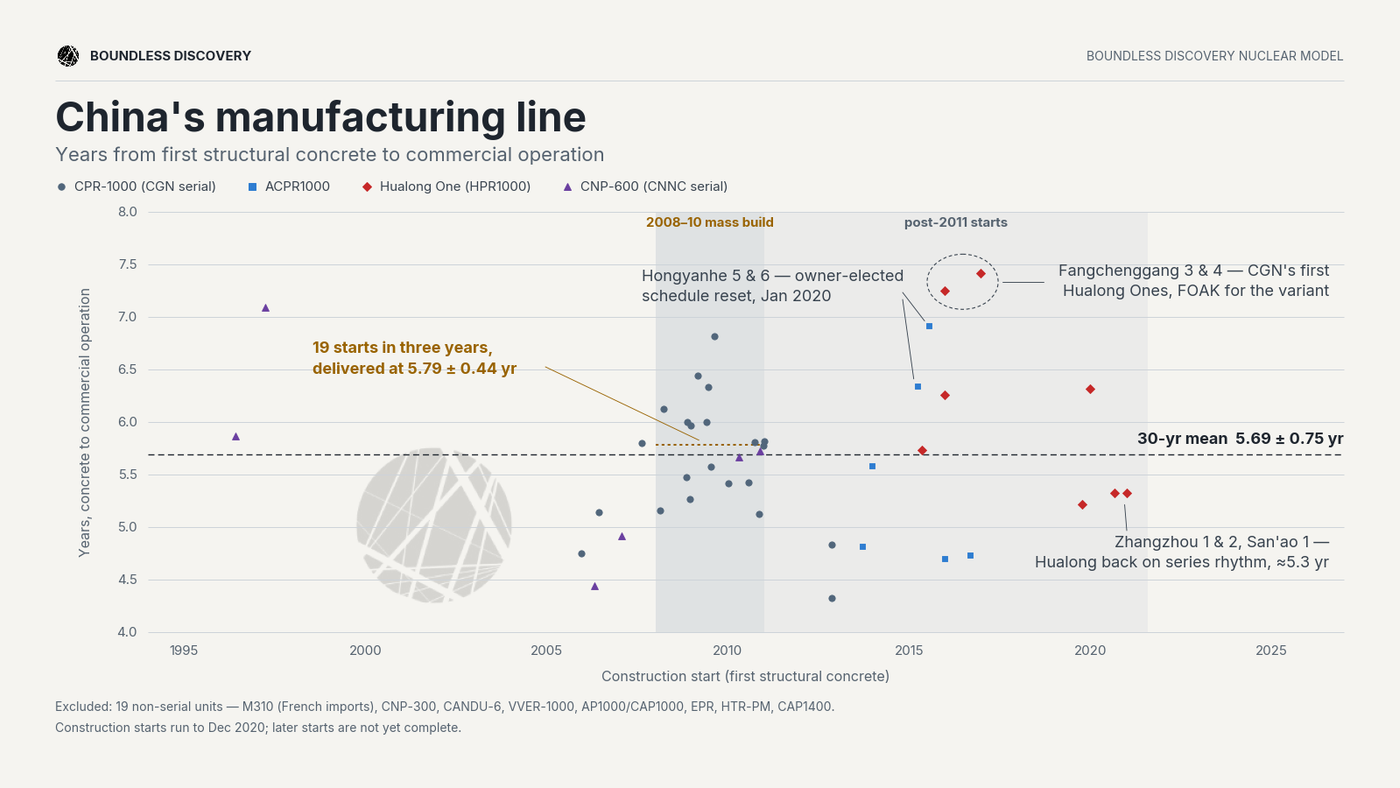
When China pours first concrete on a serial unit, the fuel-loading window can be dated immediately and contracted against with a certainty no previous build cycle offered. That window today is less than six years - and it is dropping. Whether supply can answer inside it is the structural problem the next section addresses.
1.2 Supply is a Probability Stack
Demand is now visible against firm schedules whereas the timing of supply is far more precarious. A production forecast mixes pounds already being delivered with pounds that still depend on permits, a final investment decision (FID), construction, commissioning and ramp-up. Our model, therefore, sorts supply by confidence: 'Firm' is mines already operating or ramping; each tier beyond it carries more development risk and less certainty over timing and output.
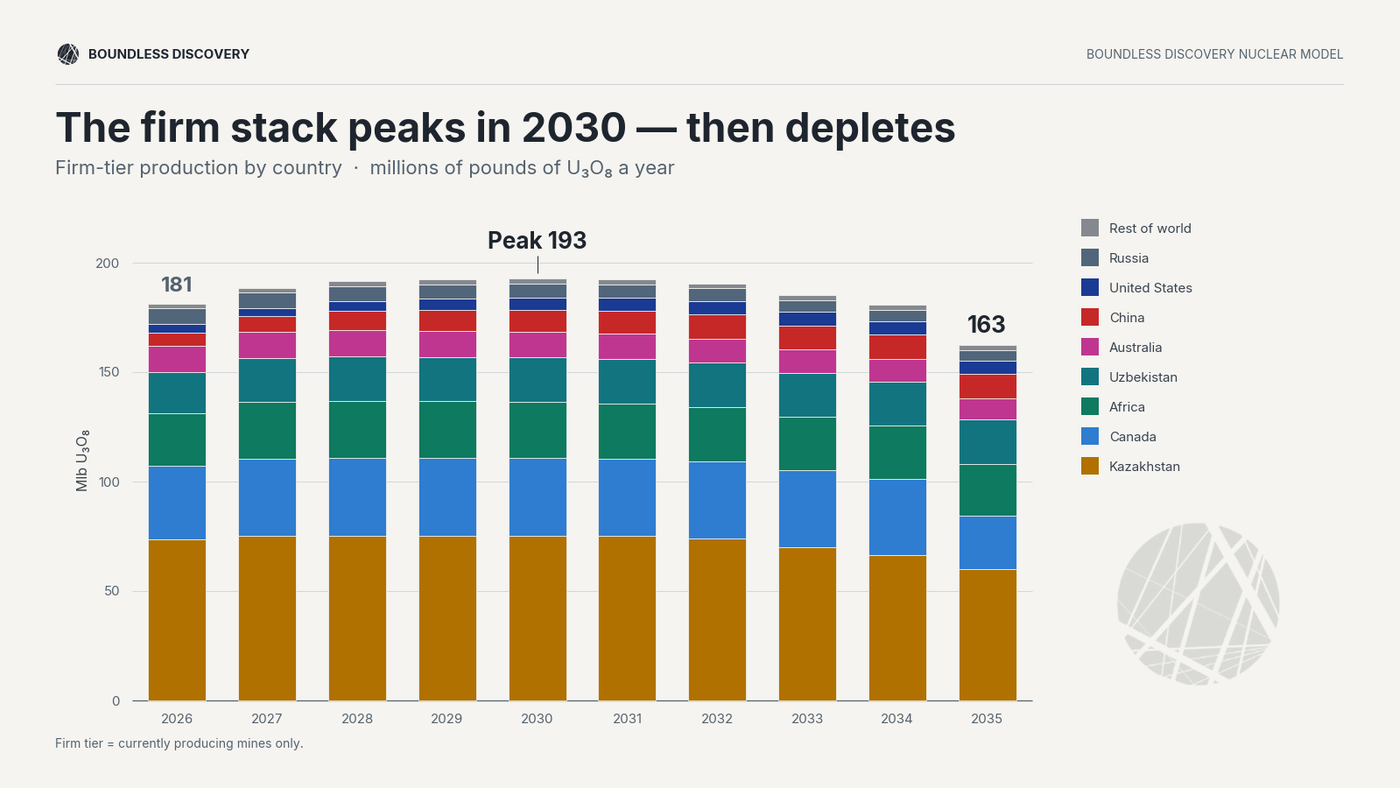
Start with the existing base, and the immediate problem comes into focus. Current Firm supply peaks at 193 Mlb in 2030, then declines sharply to 163 Mlb by 2035 (Figure 8). The fall reflects depletion across today's existing mines. New projects must first replace that lost output before they can meet a single pound of demand growth.
The wider pipeline looks larger, but only because it stacks far less certain supply (Figure 9). Count our two tiers beyond ‘Firm’ and ‘Probable’ - ‘Possible’ and ‘Speculative’ - then 2035 production could reach ~304 Mlb annually. 141 Mlb per year of that figure, however, depends on projects that have not yet been built and, in many cases, remain unpermitted, unfunded or technically unproven.
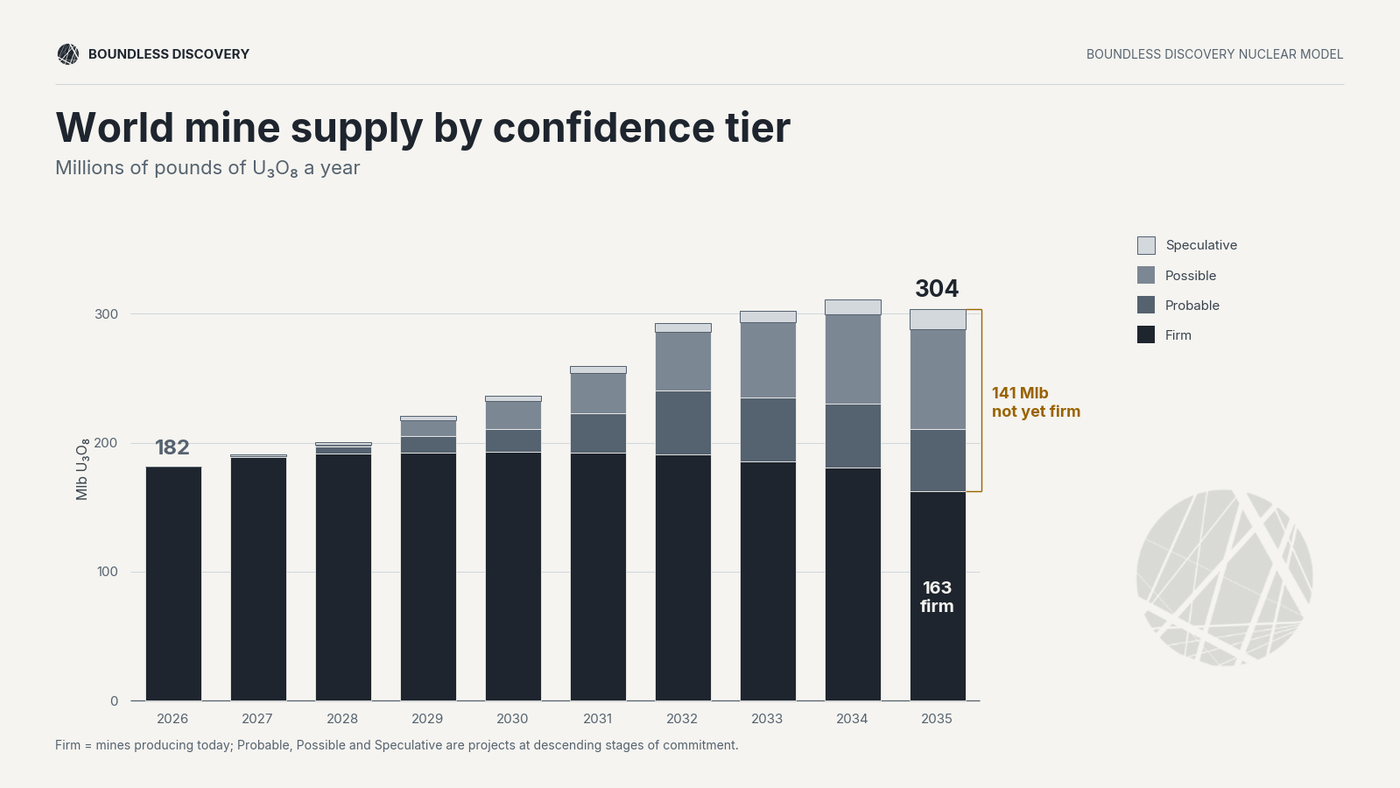
Classification is about timing, not necessarily viability. A project can hold a defined resource, finished studies, even regulatory approval, and still lack a committed investment decision. The risk also does not end when construction has finished: units ramp slowly, run below nameplate, or need further development before they stabilise. Pounds can stay in the forecast while arriving later, or in smaller quantities than the headline schedule implies.
So, the supply outlook improves only by leaning harder on mines that have never demonstrated reliable production. The question is not whether these deposits get built, but whether their pounds arrive inside the window scheduled reactors actually need them. That is what decides the cumulative balance: Firm mines alone cannot cover the decade, so the market needs a real contribution from Probable and Possible projects.
The base case, therefore, depends on Probable projects arriving on schedule and rebuilding a genuine supply cushion requires Possible projects to cross FID, which will require higher, durable uranium term prices and contracts capable of supporting the financing of new projects.
1.3 Historical Buffers Are Weakening
Two historical sources of secondary supply allowed reactor requirements to exceed annual mine production for decades: material already above ground and spare enrichment capacity. Neither has disappeared, but both are becoming less dependable and fungible. Secondary releases are declining while financial vehicles and new sovereign buyers accumulate more uranium. At the same time, Western enrichment constraints are pushing the fuel cycle away from uranium-efficient enrichment and towards greater natural uranium use.
Less Uranium is Being Released
The inventory buffer. Utility and producer inventories, government stockpiles, recycled material, re-enriched tails and weapons-derived uranium have long topped up mine production, letting reactor demand run ahead of annual output without a visible shortage. This era of abundant inventory buffers is now coming to an end. Inventories are only past production carried forward – rebuildable in aggregate only when supply exceeds demand again. Secondary supply has already fallen hard, from roughly 65 Mlb in 2022 to about 25 Mlb today, and UxC expects it to keep sliding towards 17 Mlb by 2030. The above-ground cushion that once hid the primary deficit is drying up.
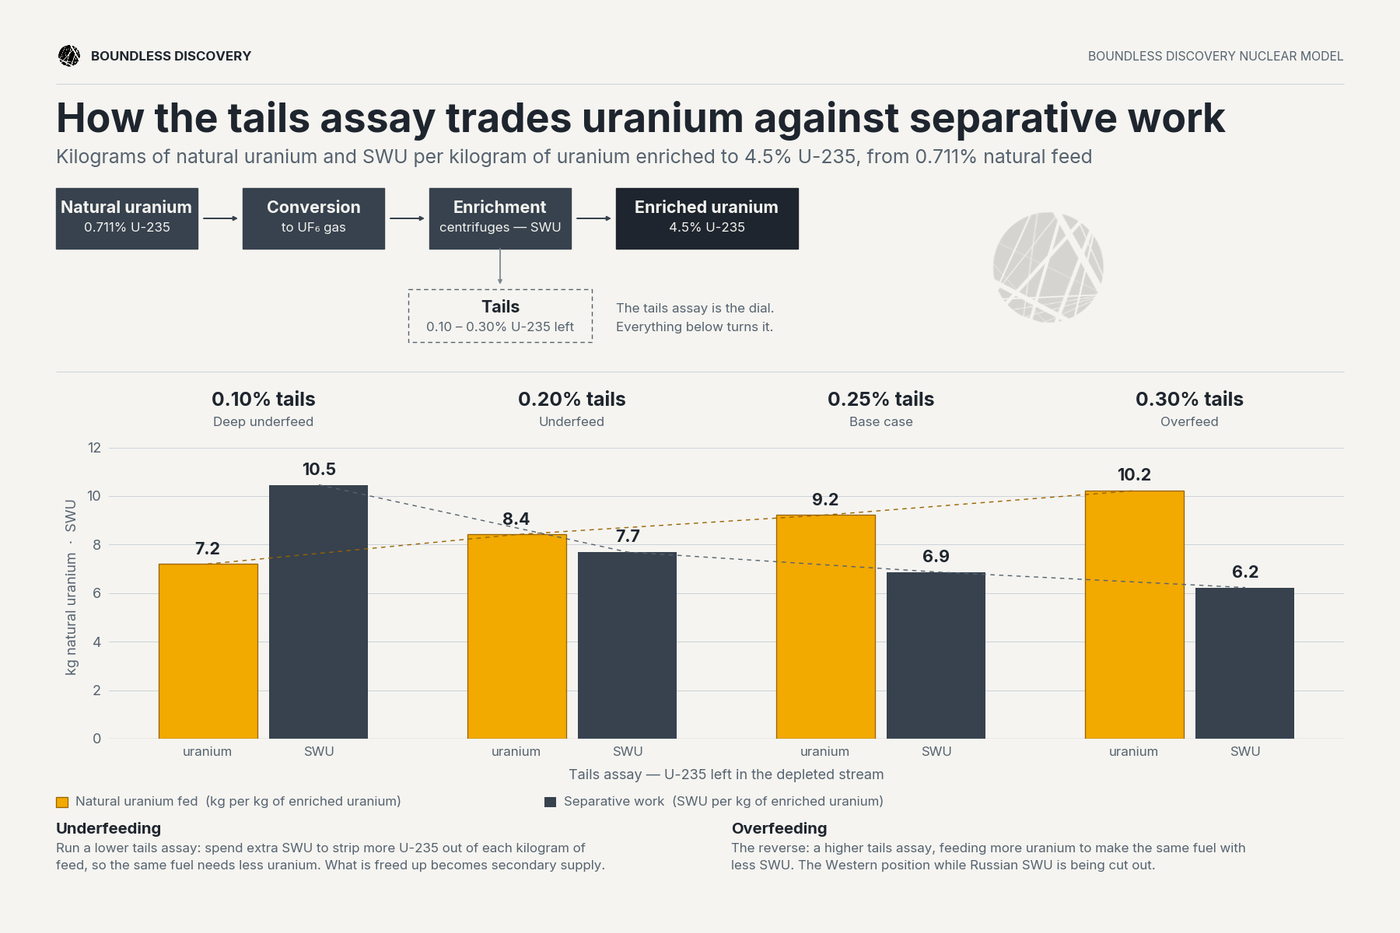
The enrichment buffer. Enrichment raises the concentration of fissile U-235 in natural uranium to the specific level required for reactor fuel. Enrichers can reach that level using different combinations of uranium feed and enrichment effort (Figure 10). At a lower tails assay, they extract more U-235 from each pound of uranium, using more separative work units (SWU) but less natural uranium. This is underfeeding. At a higher tails assay, they do less enrichment work and leave more U-235 behind, so more uranium is needed for the same amount of fuel. This is overfeeding.
The effect is substantial. Holding the reactor fleet constant and changing only the tails assay, cumulative natural uranium requirements over 2026–35 range from 2,019 Mlb at 0.20% tails to 2,425 Mlb at 0.30%.
Russia’s Enrichment Dominance: Russia holds ~43% of global enrichment capacity and has consequently facilitated much of the world's underfeeding. A wall of Russian sanctions is now being put up by the West — the UK banned Russian fuel in 2026 (full phaseout by 2028) and a hard US ban on Russian uranium commences January 2028. Any spare Russian SWUs will be severed from the West. The EU will likely stay connected out of necessity despite Western capacity expansions. This is because even if every announced Western enrichment expansion is completed in full and on schedule, non-Russian capacity does not cover combined Western bloc requirements over the next decade (Figure 11). (We will address enrichment in full in a separate article)
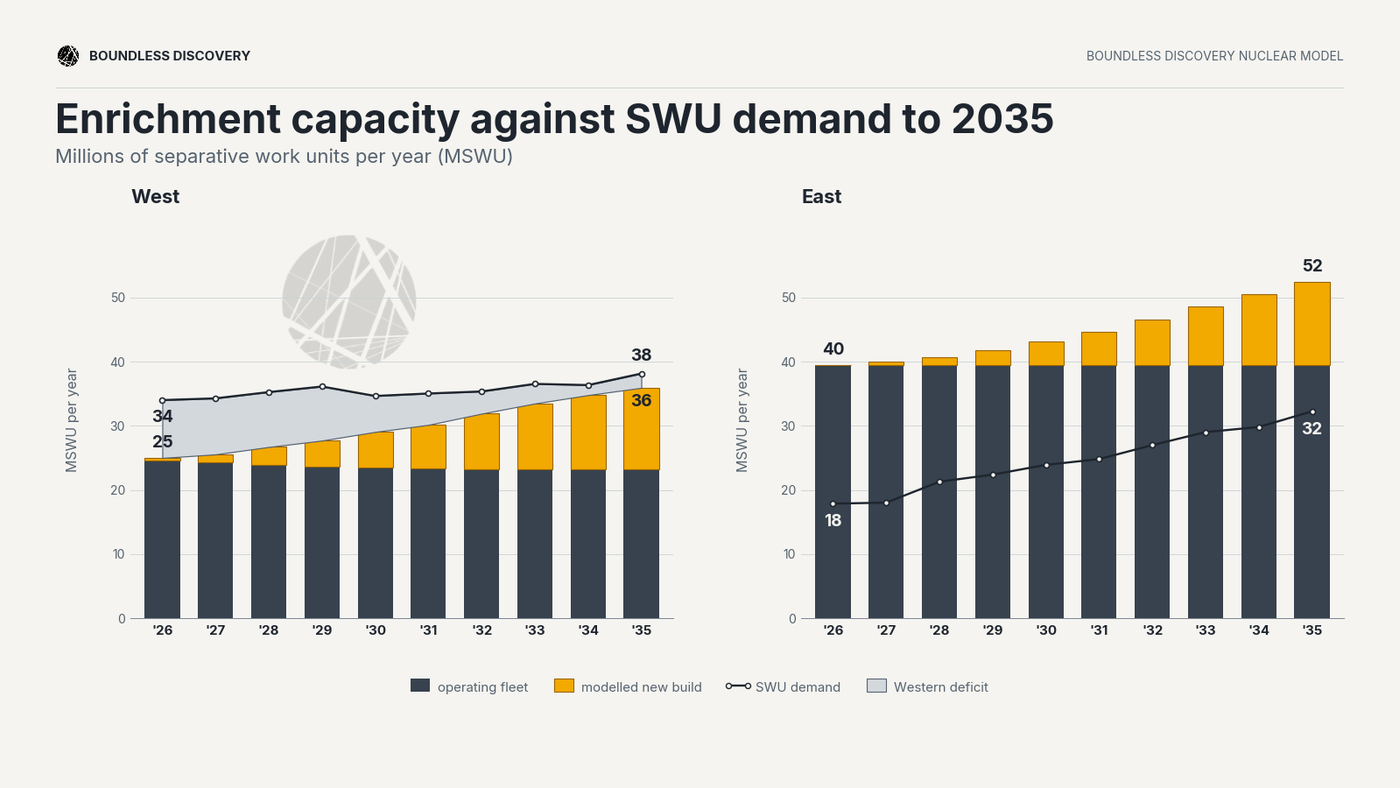
EU dependence on Russian SWU persists: Western capacity cannot replace it within the decade, even as European buyers actively try to de-risk their exposure. But US and UK bans will tighten the non-Russian market as their demand is redirected towards Western enrichers: Urenco, Orano and Centrus. The adjustment will therefore come through a combination of continued European procurement from Russia and higher tails assays across the Western system. Short of SWU capacity, enrichers will be forced to overfeed - using more natural uranium to produce the same amount of fuel. The historical enrichment buffer therefore inverts: instead of underfeeding creating secondary uranium supply, Western SWU scarcity adds directly to yellowcake demand.
We'll be watching Piketon's build-out closely: Centrus's new low-enriched uranium (LEU) facility expansion is sized to satisfy the company's existing $2.4 billion commercial sales backlog. These backlogged contracts are legally binding on the customer side with utilities committed to buy the SWUs but delivery is contingent on Centrus actually building the new capacity at Piketon. Once again, demand is booked but supply is contingent.
More Pounds Are Being Withdrawn from Availability
As traditional secondary sources release less material, other buyers are absorbing what remains. Financial vehicles purchase natural uranium on the spot market then warehouse it for price exposure while sovereign buyers continue to accumulate it for security of supply. Neither appears in reactor-consumption forecasts, yet both compete for the same pounds and tighten supply.
Financial vehicles: Sprott and Yellow Cake Plc raise equity capital to buy and hold physical uranium. Their structures are designed to retain material rather than supply utilities, so their combined 106 Mlb is effectively removed from the market unless they actively choose to sell. Yet when investor capital is available, they can re-enter as buyers and withdraw more uranium – as Sprott did on Tuesday 28th July.
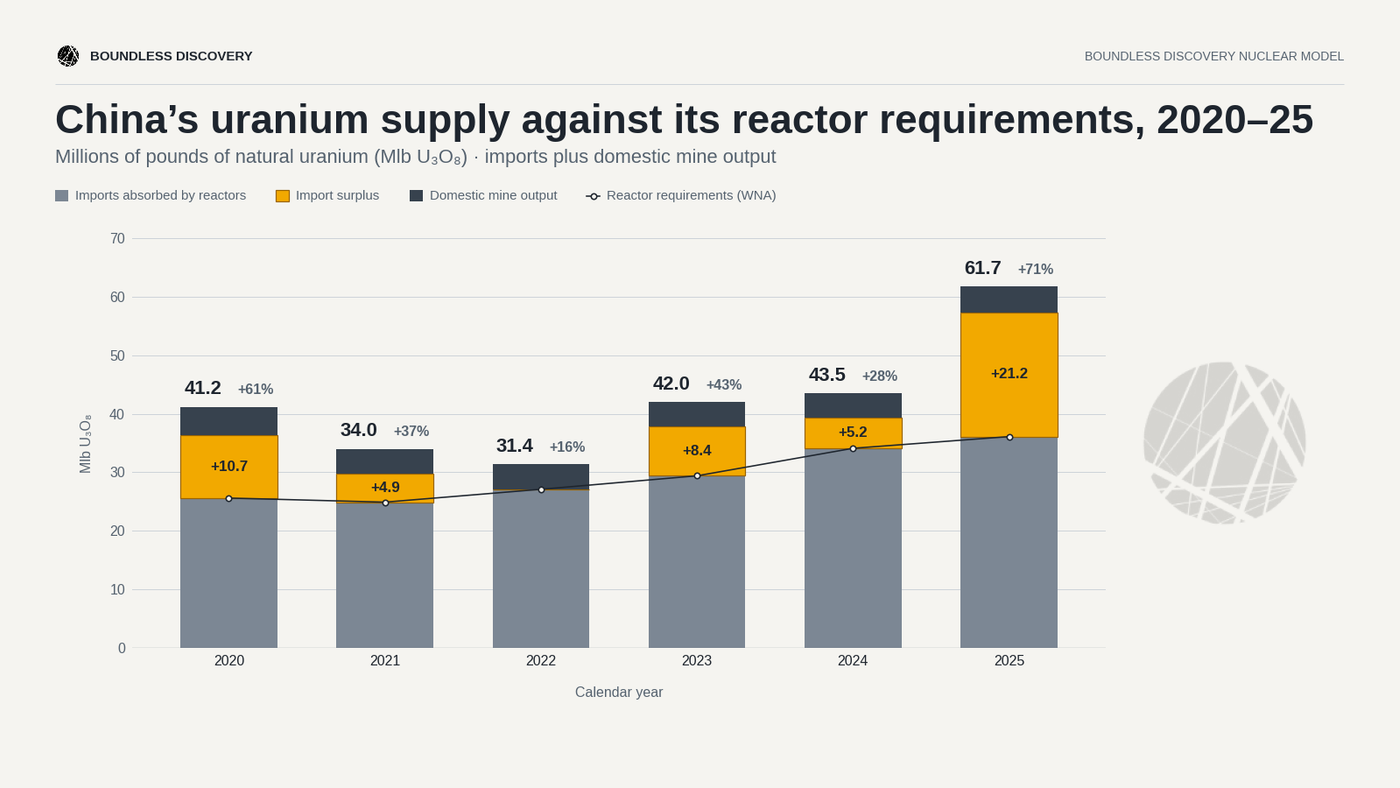
Sovereign stockpiles: China spent a record ~$5.8bn on nuclear-fuel imports in 2025, including $3.5bn on natural uranium. Its yellowcake procurement alone (excluding enriched uranium and fabricated fuel) exceeded the annual requirement we project for its reactor fleet in 2030, with more than 90% sourced from abroad. That is better understood not as overbuying against today’s fleet, but as procurement against China’s future fleet. The breakdown between immediate consumption, utility inventory, strategic reserves or military uses cannot be assigned as China discloses little. That said, the signal is directional: China is sourcing materially more natural uranium than its fleet requires, and its 2025 surplus alone exceeded the roughly 17 Mlb of annual secondary supply UxC expects to be released later this decade (Figure 12).
The market’s traditional release valve is tightening from every side. Secondary supply is declining, the loss of non-Russian spare SWUs is closing off underfeeding, and financial and eastern sovereign buyers are pulling material out of the pool. For thirty years, these buffers suppressed the deficit; now the demand side must come to terms with a structural seller-led market.
1.4 The Base Case Leaves No Margin for Error
Figure 13 isolates the primary balance: modelled mine production against our base case reactor requirements.
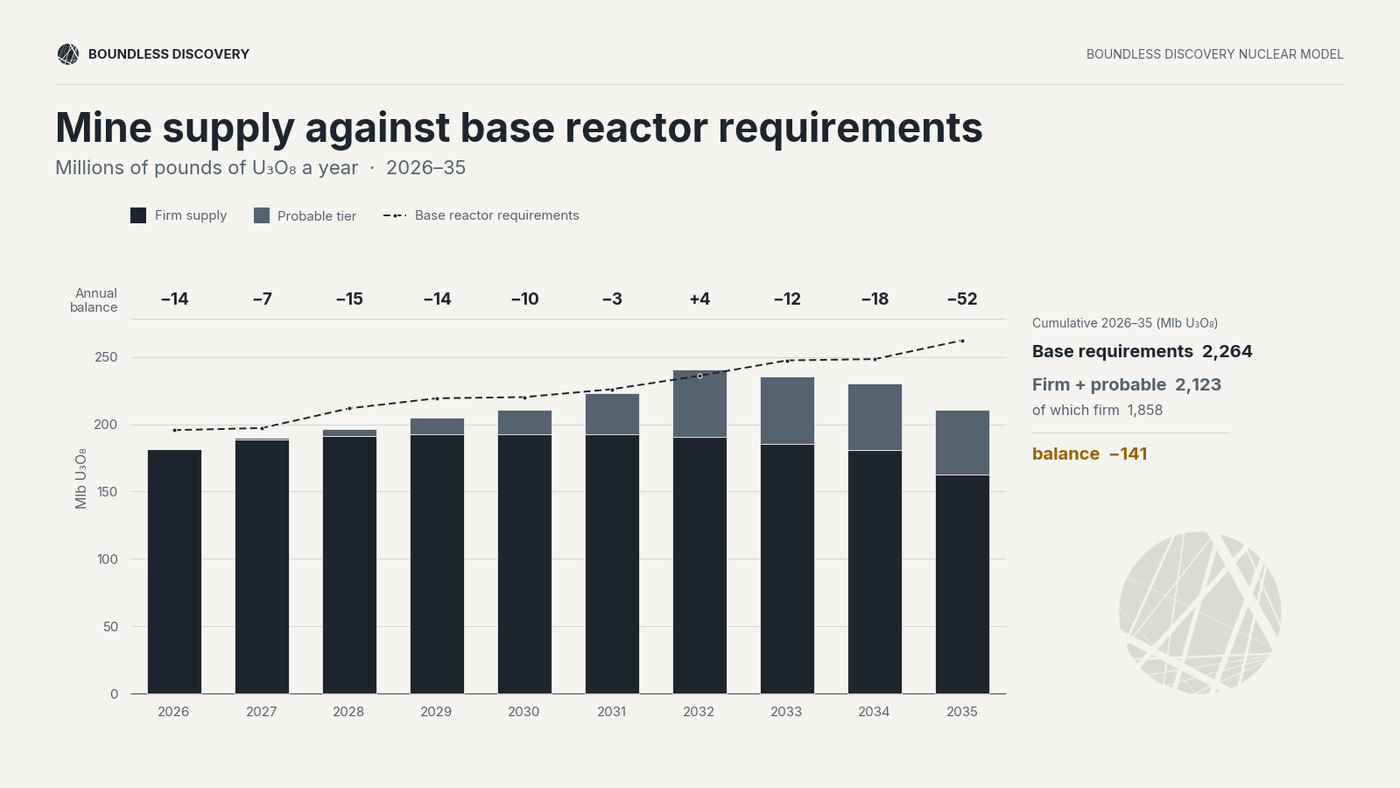
Across the decade, Firm and all Probable supply total approximately 2,123 Mlb of natural uranium against 2,264 Mlb of base reactor demand, leaving a 141 Mlb primary deficit. The gap this decade could be bridged by secondary supply but it also ignores evidenced stockpiling by countries such as China, financial vehicles removing pounds from the market, and the increasing likelihood of Western overfeeding.
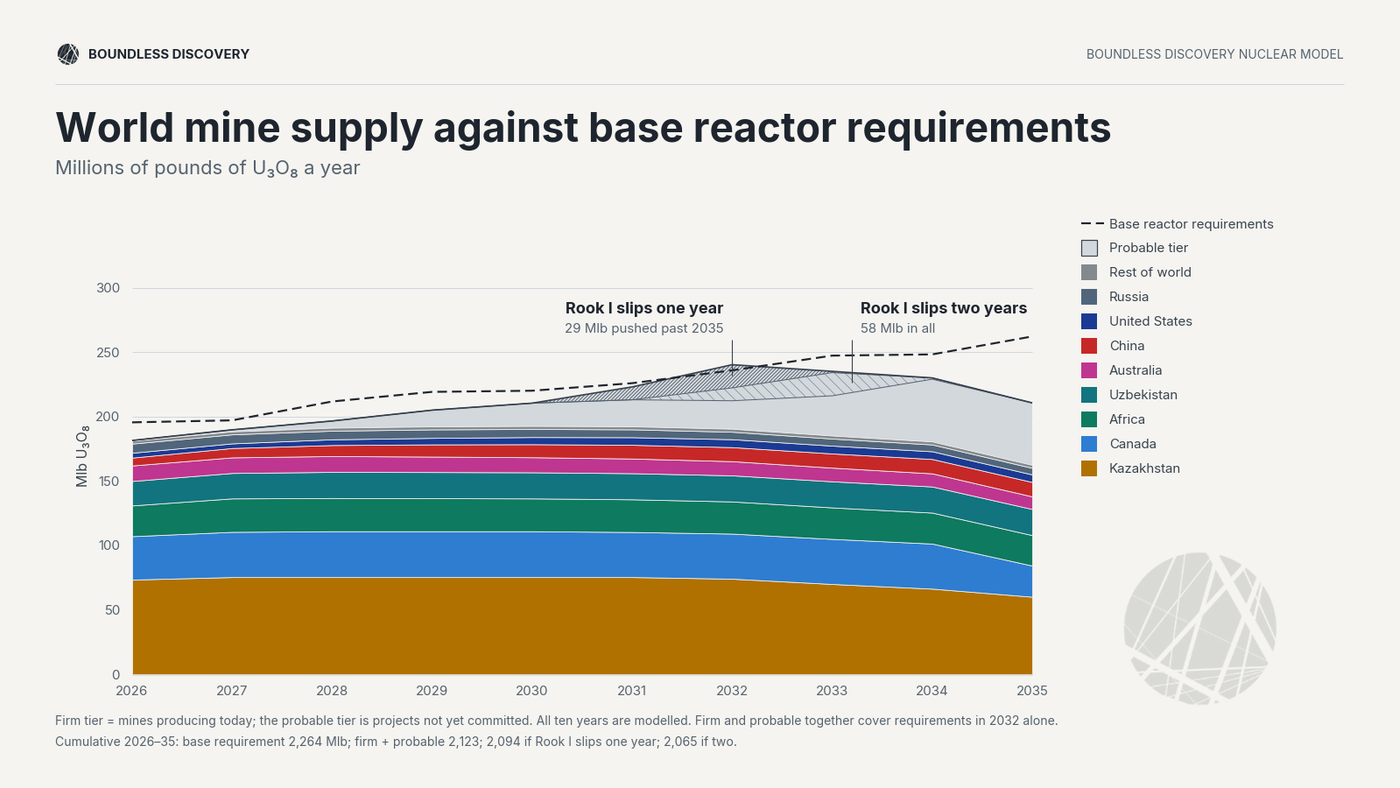
Execution risk is concentrated. The register of probable mines is also not a diversified portfolio. Canadian developer NexGen guides its Rook I mine to approximately 29 Mlb per year at full production. At its peak, Rook I will comprise 15% of global annual production. Any major delays or issues during construction would severely worsen the supply crunch. NexGen guides first production from its Rook I deposit in 2030; we forecast a one year delay versus their guidance , in short, because the very first mine NexGen will build is a large, remote project from scratch, including two deep shafts (Figure 14).
1.5 Additional Demand Upside
The base case excludes less-certain projects, life extensions, uprates, restarts, SMRs and the increasing likelihood of AI-driven hyperscaler demand. If these projects materialise, they become additional claims on a market that already has no margin. Under the broader scenario shown in (Figure 15), annual requirements could reach 309 Mlb by 2035, versus 262 Mlb per year in the base case.
Part I established that the aggregate balance has almost no margin. Part II asks whether higher prices can bring enough new supply forward before those scheduled reactor requirements arrive.
Part 2: Why the Market will Struggle to Correct in Time
2.1 Reactor Requirements do not Respond to Price
Once a reactor is operating, its reload schedule is largely fixed. Natural uranium is roughly 5% of lifetime generation cost, so even a sharp price rise does not change how much fuel a reactor burns — no operator throttles a multi-billion-dollar asset to economise on uranium costs. Price therefore acts on procurement, not consumption: utilities can accelerate or defer contracting, or lean temporarily on inventory, but every pound drawn down is a pound that must be repurchased later. Higher prices do not catalyse demand destruction; they only move procurement through time.
2.2 Scarcity is Allocated Years in Advance
Most uranium is sold under multi-year term contracts signed years before delivery. The spot market still matters as it reveals marginal scarcity but it only allocates a fraction of total physical volume.
In a well-supplied market, a buyer that contracts late can usually still cover its remaining requirements. In a tight market, timing becomes more important. As the supply books fill, later buyers face a narrower set of suppliers, greater reliance on future production and are forced further up the cost curve.
Uranium is not literally allocated on a first-come, first-served basis: producers still choose between buyers according to price, volume, contract length and strategic relationships. But rising term prices do little to reduce reactor requirements. Instead, by signalling that available supply is being claimed, they can prompt uncovered utilities to accelerate contracting, intensifying competition for the remaining pounds.
2.3 New Mine Supply Responds Too Slowly
If demand won't retreat because of its inelasticity, the balance must come from new supply. This exit is also not an escape hatch without a true paradigm shift in uranium mining. The binding constraint isn't geology; Australia and Canada sit on some of the world's largest reserves. It's every gate between a deposit and reliable production: slow regulators, capital that commits only against a price it trusts to hold for years, and the many projects stalled in front of a final investment decision (FID) they can't finance.
Greenfield uranium mines have historically taken well over a decade to move from discovery to first production. Across the six operating Australian and Canadian mines (+1 historical), discovery to first production ran nine to 39 years (Figure 16).
That does not mean every advanced project today requires another decade. It demonstrates how much of the development cycle lies outside physical construction. For the current pipeline, the relevant clock runs from each project’s present status through studies, financing, construction, commissioning, and stable production.
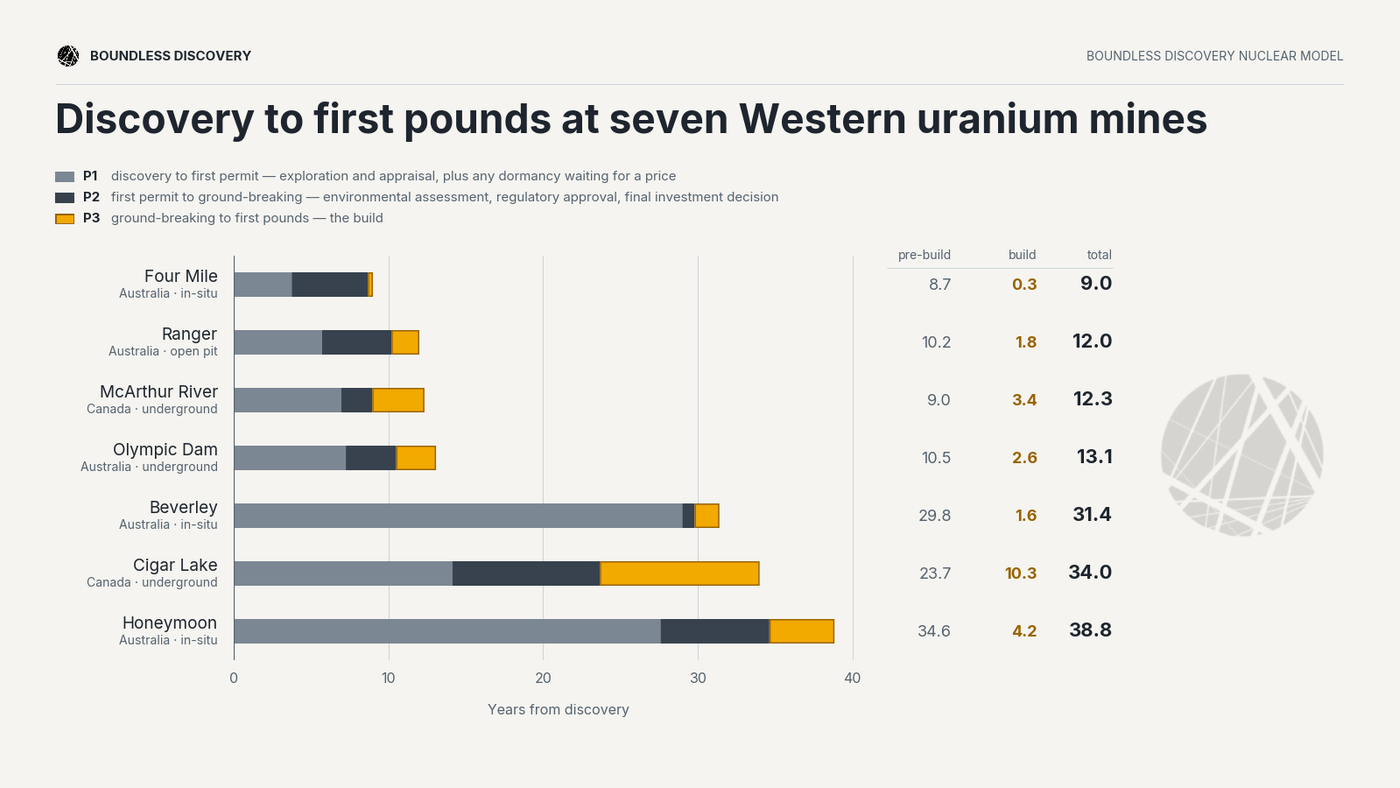
Construction is often the shortest phase: months for some ISR wellfield expansions and two to four years for many conventional mines. Much of the uncertainty sits before and after it – in studies, permitting, financing, infrastructure, commissioning and ramp-up.
Permits do not guarantee pounds: Until financing is committed, FID is taken and the asset reaches stable production, its scheduled output remains contingent. (Figure 17) shows the long road each project must take.
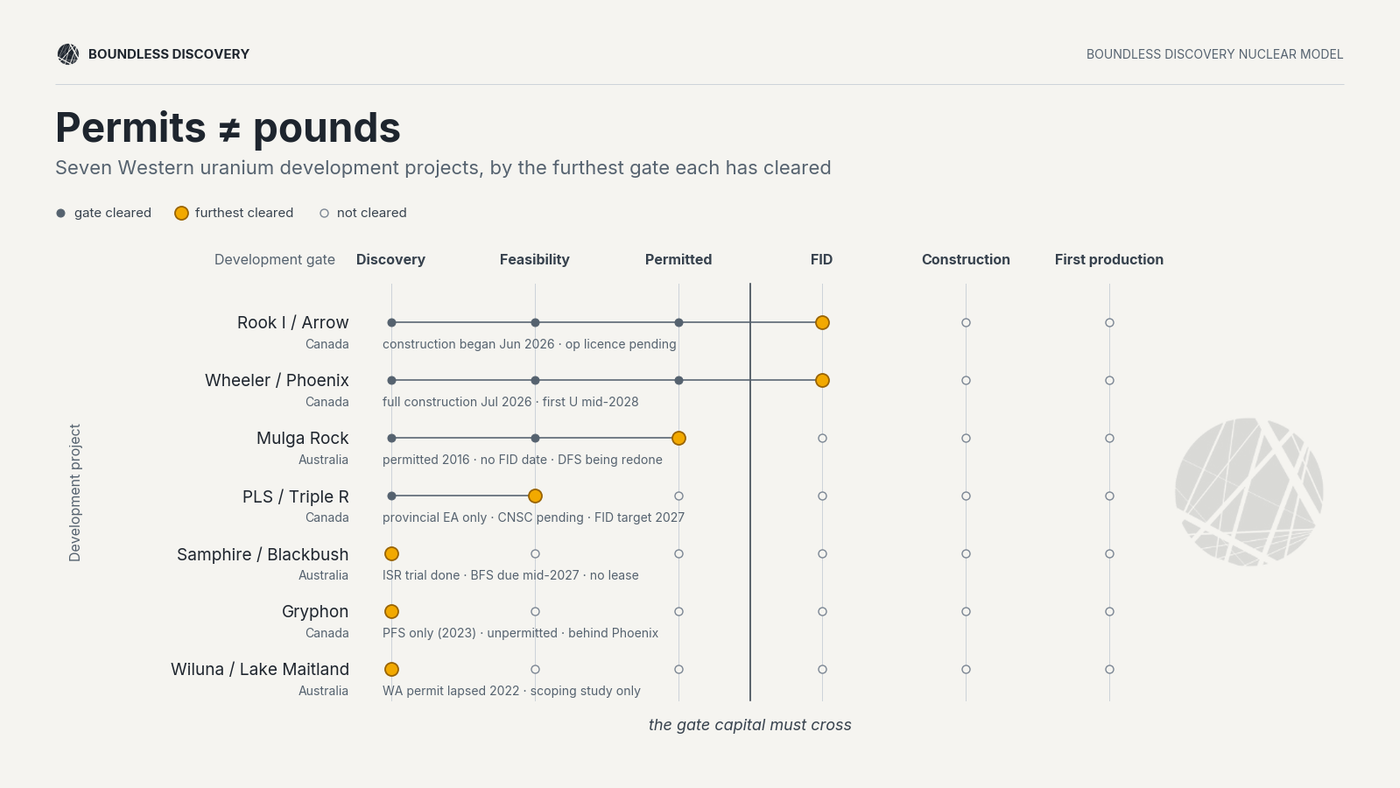
Of these seven Western projects, only Arrow and Phoenix had crossed FID by 2026, and both still faced regulatory and execution steps before production. Mulga Rock had remained permitted for nine years without an investment decision; the remaining projects were still in feasibility, permitting or financing.
2.4 Additional Supply Constraints
Idled mines do not restart overnight: Reopening requires fresh financing, equipment, replacement staff, regulatory approvals and renewed wellfield or underground development. ‘Restart’ capacity is therefore less immediately available than the headline suggests.
A high spot price alone does not finance a mine: Developers and lenders need confidence that prices will persist through construction and payback, and that confidence is generally signalled through long-term contracts with creditworthy buyers.
The term market, therefore, performs two roles: it allocates existing production and underwrites future supply. When utilities defer contracting, they do not merely postpone purchasing; they also delay the bankable demand signal that could move ‘Possible’ projects through FID. The same deferral that leaves buyers uncovered later can leave the pounds they will need in the ground.
Producer caution is learned. For decades, uranium mines competed with government inventories and weapons-derived material, most visibly through the Megatons to Megawatts program. Demand was then repeatedly reset by nuclear accidents, policy reversals, and contracting busts.
Developers that financed assets against temporary price spikes were punished when demand or prices collapsed before those mines could repay their capital.
The producers that survived, therefore, learned to expand against durable contracted demand, not the spot price alone. Cameco’s current ‘supply discipline’ strategy illustrates the point:
“We have no incentive right now to accelerate [McArthur River] in any way… We’re not being told by the market, with volumes of demand, that it’s time to do anything different. McArthur has produced at 18 before, it’s produced at 20 before, and it has a licence to go to 25. We are just timing it and pacing it as part of our demand strategy and our discipline strategy.”
— Grant Isaac, Cameco FY2025 conference call, February 2026
The constraint is not Cameco’s physical ability to produce more but that the contracted volumes do not yet justify changing the production plan. Higher prices improve the economics of expansion, but producers still require buyers to demonstrate that the demand will persist.
In-Situ-Recovery (ISR) appears to offer a faster response. Wellfields can be developed incrementally and brought online more quickly than large conventional mines, which is one reason Kazakhstan and Uzbekistan dominate low-cost production growth. While ISR shortens the physical construction phase; it does not remove the wider dependencies. Expansion still requires permitted deposits, drilling capacity, sulphuric acid (currently in shortage), infrastructure, finance and state approval.
Higher prices can improve project economics and pull more deposits towards investment. But capital will move at scale only once scarcity is severe enough — and believed to be durable. By then, the contracting process that pushes prices higher to unlock new supply will already have allocated much of the most certain existing production.
Prices may finance the next wave of mines, but they cannot compress permitting, construction, and ramp-up enough to deliver large volumes inside the decade. The market must therefore tighten before it can elicit the supply response, and the buyers arriving latest will endure that tightening most.
Part III asks who is positioned to secure those pounds first.
Part 3: Why the Shortage Will Not Be Shared
The global balance analysed above assumes that every buyer can compete for every pound. In practice, a substantial share of production is already directed by mine ownership, physical entitlements, offtake agreements, sanctions and sovereign fuel-security priorities before it reaches the contestable merchant market.
Of the 2,123 Mlb of Firm and Probable production in our model, 583 Mlb is effectively unavailable to Western buyers because it is produced within, owned by or committed to Chinese, Russian, and Indian sovereign fuel systems. China and India require growing volumes for their domestic reactor buildouts, while Russian-controlled production supports both Rosatom's domestic fleet and its expanding network of overseas customers. Western sanctions further restrict access. We therefore classify these pounds as Eastern-captive: not because they could never move West, but because Western utilities cannot ordinarily compete for them through standard term contracting.
A further 241 Mlb is treated as Western-captive — principally US domestic production, Orano's attributable production (except for its Kazakh joint venture), and Japanese physical entitlements in Kazakh joint ventures. This category includes only pounds for which there is a clear strategic, contractual or institutional mechanism likely to direct production towards Western requirements in a supply-constrained market.
Orano is the main judgement call within this category, and we resolve it by asset rather than by owner. The company is French state-controlled, vertically integrated across the fuel cycle and strategically important to French and wider European fuel requirements. But ownership is a claim about who decides, not about where the pounds go — and on its Kazakh-based production the company has told us where they go. Asked about the destination of output from KATCO, its 51% joint venture with Kazatomprom, Orano told AFP news that the uranium goes "pour l'essentiel à des clients chinois" — for the most part to Chinese customers — adding that it is not France's only supplier. A stake whose output is seemingly directed mainly to China is not reserved to Western requirements in any operative sense. We, therefore, classify Orano's 52 Mlb attributable share of KATCO as contestable; all of its other attributable production remains Western-captive, principally the Canadian equity marketed through Cameco into Orano's own book.
Contestable is the right classification here rather than Eastern-captive: these pounds are sold to Chinese buyers under commercial contracts that expire, not held inside a Chinese sovereign system, and it is Orano that decides where the next tranche goes.
Cameco is treated under the same test and lands in the same place. Its production is geopolitically aligned with the West, but it markets globally and holds live contracts with Chinese and Indian buyers, so its pounds sit in the contestable pool. The distinction is not French versus Canadian, or state versus listed. It is whether a pound enters a merchant book that any buyer can bid into.
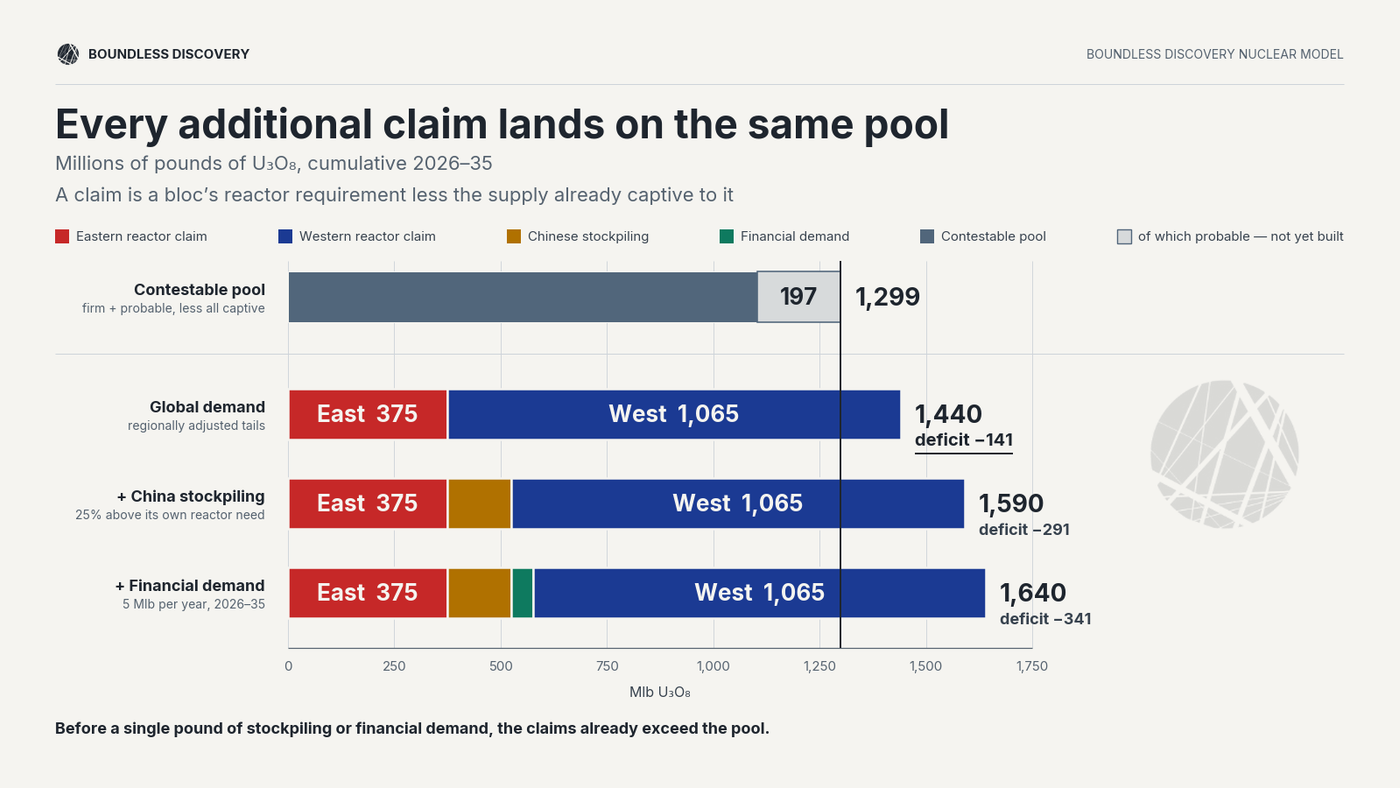
The remaining 1,299 Mlb forms the contestable supply pool. 'Contestable' does not mean uncontracted or available. It means the production is not structurally reserved for either side and can, in principle, be sold to buyers across both systems. This pool includes merchant supply controlled by leading producers such as Cameco, Kazatomprom, Navoiyuran and the Australian miners.
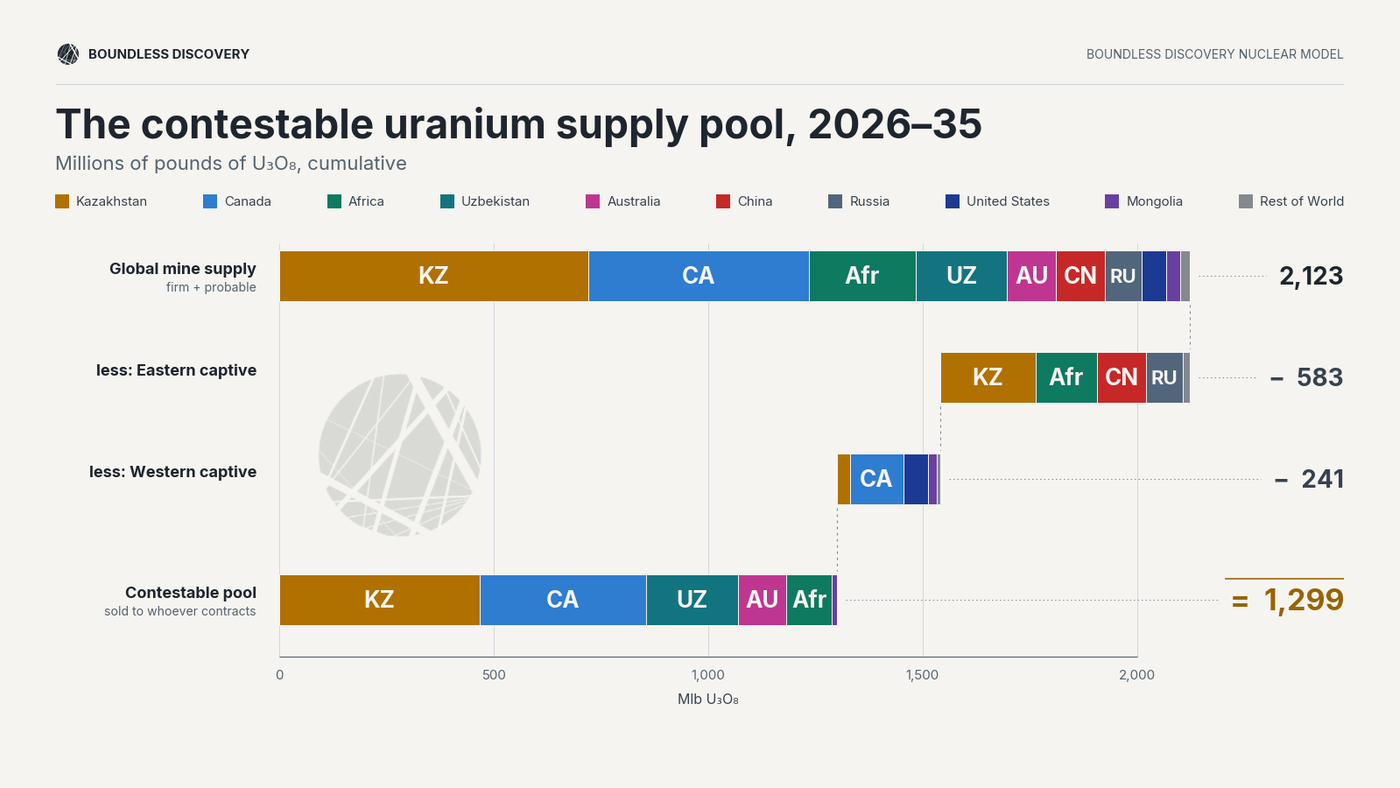
This is what we call the one-way membrane. Eastern sovereign systems enter the decade with 583 Mlb of captive production and can still compete for the 1,299 Mlb contestable pool. Western buyers enter with 241 Mlb structurally reserved — less than half the Eastern figure — and cannot ordinarily compete for Eastern captive production in return. Western-controlled merchant pounds can move East; Eastern captive pounds move West only if their sovereign holders choose to release them, likely at a higher commercial or strategic price.
The asymmetry is reinforced by how each side procures. China, Russia, and India aggregate demand across state-backed fleets and can contract against national construction programmes, strategic reserves and long-term energy-security objectives. US utilities, by contrast, procure independently against their own coverage positions.
3.1 Why the East is Reaching the Pool First
The global shortage is being allocated in advance because much of the demand growth comes from reactors supplied through closed, state-backed fuel systems (Figure 19).
In our base case, Eastern-bloc uranium demand rises by nearly 80% between 2026 and 2035, from about 69 Mlb to 123 Mlb a year. Western demand increases by around 12 Mlb (excluding speculative projects). The West's share of global demand consequently falls from roughly 64% to 52%, still the larger bloc throughout the decade but only narrowly by its end.
The significance is not just where demand is growing, but how that demand is procured:
- China’s fuel purchases are concentrated among a small number of state-owned nuclear groups that can procure against a nationally-directed construction pipeline, backed by state finance and diplomacy.
- Russia (via state-owned Rosatom) has excelled at exporting its own reactors abroad. The large majority of these are fully integrated into the end-to-end fuel cycle which Rosatom runs. Rosatom supplies the reactor technology, typically establishes the initial fuel and reload relationship, and captures the associated downstream demand for decades to come.
- India’s requirements are managed by entities under their Department of Atomic Energy (DAE) and supported by government-to-government purchase agreements. These systems are not literally single procurement books, but they concentrate decision-making and can secure supply against national requirements years in advance with little regard for profitability quarter-to-quarter.
- Western utilities understand their future needs just as well and entities like EDF (France) and Energoatom (Ukraine) also aggregate demand at the country level. The difference is most visible when contrasting the growing Eastern buyer with the world’s current largest buyer of uranium, US utilities.
The Operator Map Shows Why:
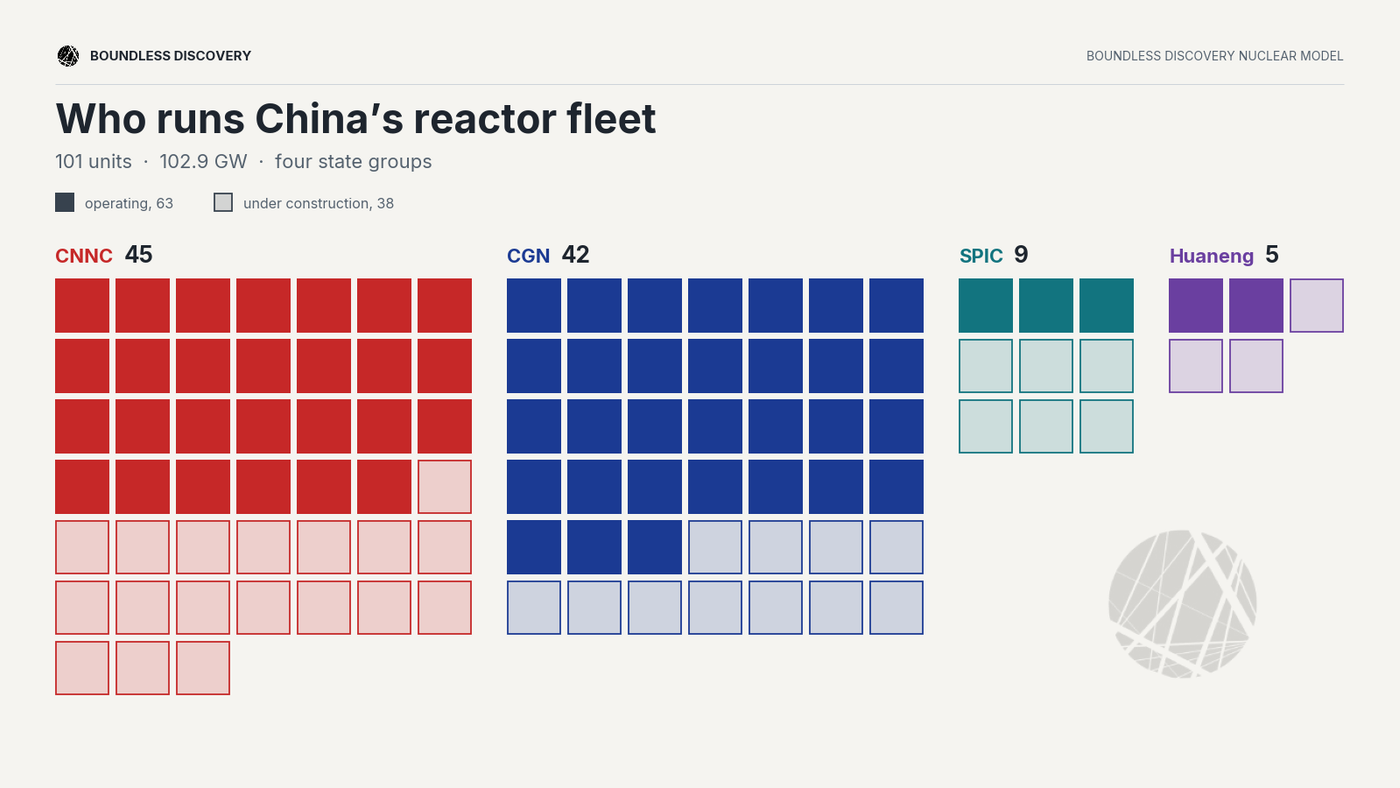
China’s reactors are run by four operator groups with CNNC and CGN dominating. Uranium is sourced principally through CNNC and CGN which both have their own mining subsidiaries. They may be domestic rivals, but both are state-owned and ultimately pointed at the same supply-security objective (Figure 20).
The United States is the inverse, an array of unaffiliated operators, each contracting against its own book and none against whether the US has collectively secured enough uranium (Figure 21).
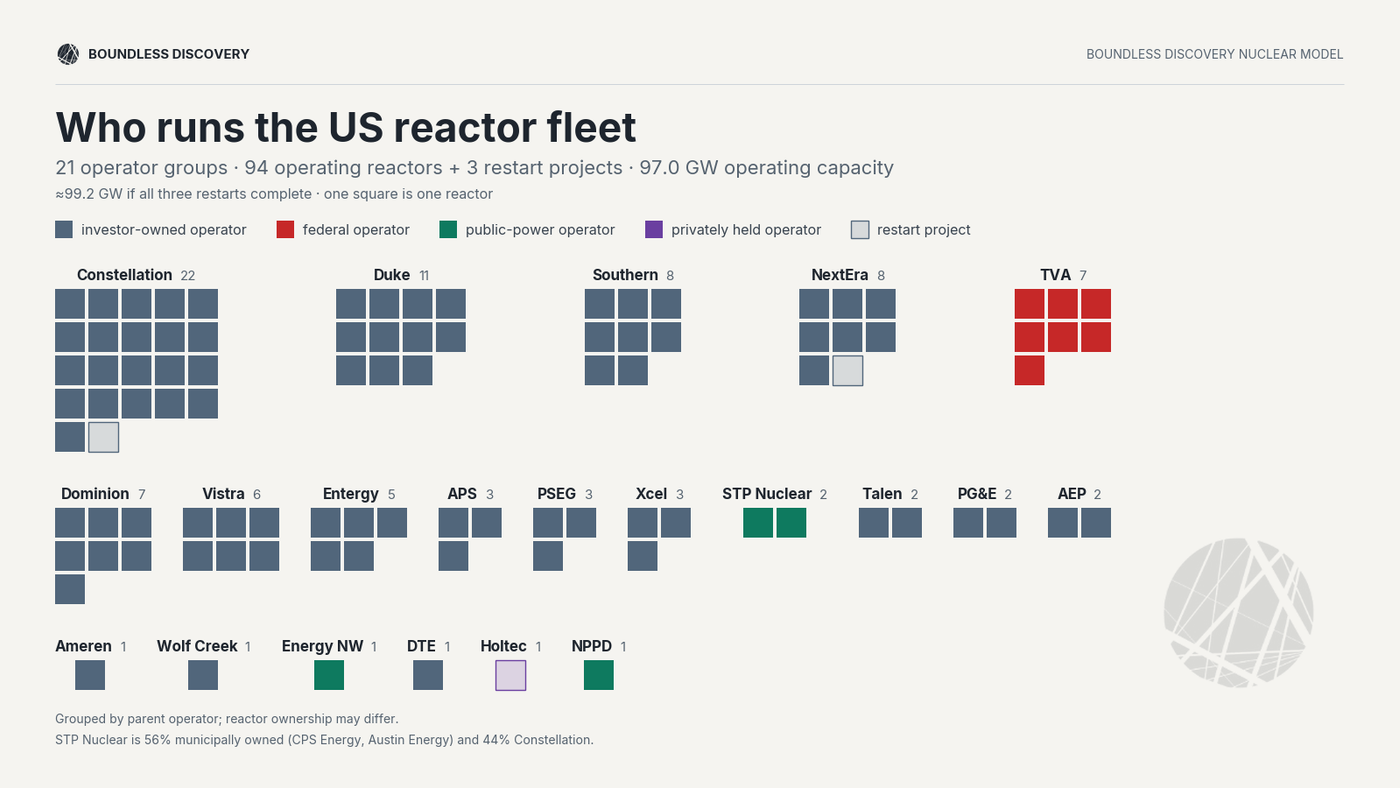
In an abundant market this difference is administrative. In a tight one, it decides allocation. The sovereign buyer contracts ahead of a shortage it can already see; the fragmented one is left with the residual.
This corporate structure decides who reaches the 1,299 Mlb contestable pool first. The next sections follow those pounds into the four producer markets where they are being contracted, financed and redirected — and asks, in each one, the question the headline number hides: how many pounds has the East already locked up from the contestable pool and how many will remain to cover the books of Western buyers?
3.2 Where the Pounds are Produced
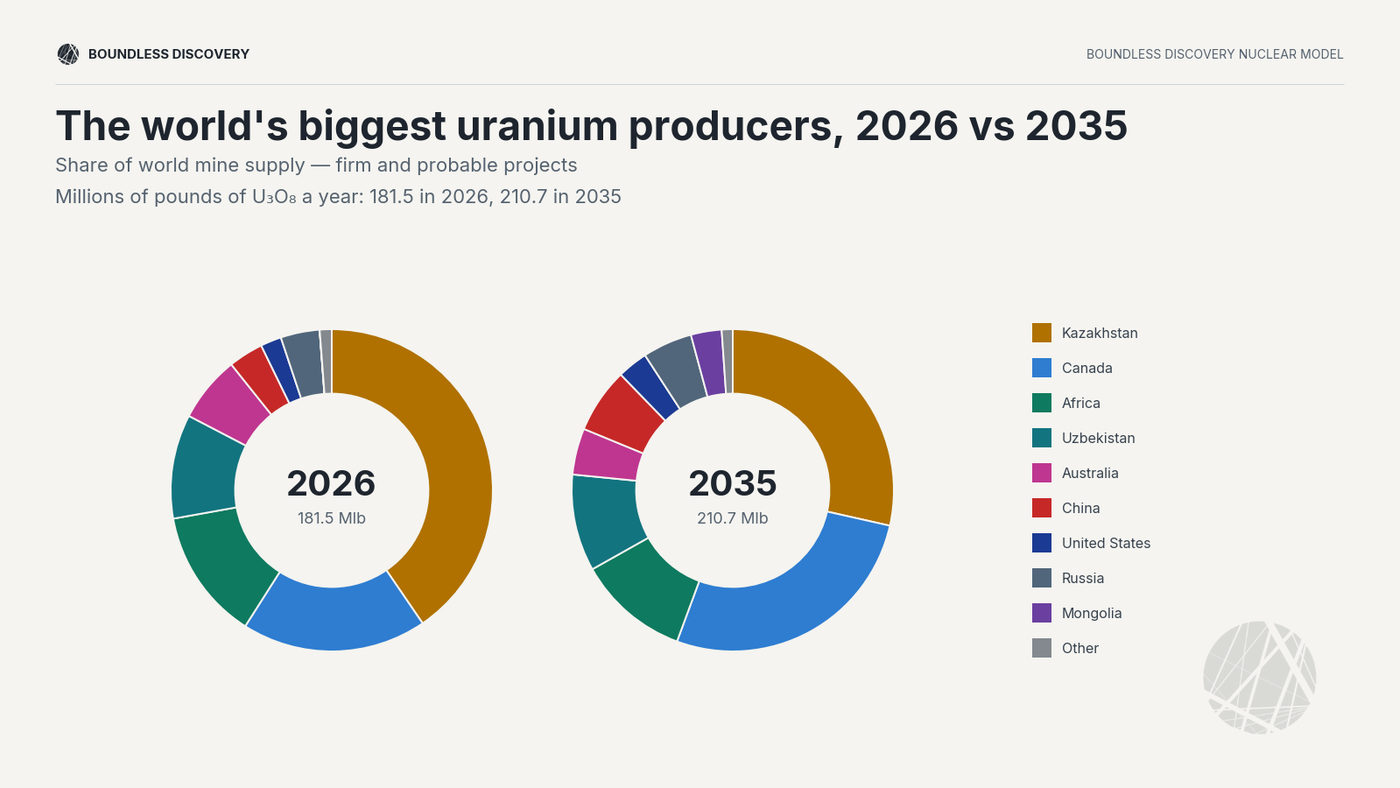
The supply pool is not diversified; Kazakhstan, Canada, Namibia and Uzbekistan provide close to four-fifths of cumulative Firm and Probable production. At current projections, Australia is the conspicuous disappointment: enormous resources, but little of the pipeline is currently Firm or Probable.
These charts (Figure 22) show where uranium will be produced, not how much stays commercially available. Our mine-by-mine supply model assigns captive production and disclosed offtake agreements. It does not deduct general long-term sales contracts. The 1,299 Mlb is a contestable pool, and the fight for it is live. The next four geographies are where it's being fought.
3.3 The One-Way Membrane
(a) Kazakhstan: Follow the pounds
Kazakhstan is where the largest open contest for uranium supply occurs. In June 2026 Kazatomprom CEO Meirzhan Yussupov described Eastern customers as "less price-sensitive, looking decades ahead". Chinese entities own 9% of Kazakhstan's uranium at the mine. In 2025, they took delivery of half of everything Kazakhstan exported.
Our supply model divides Kazakhstan's 721 Mlb of cumulative 2026–35 production three ways. 223 Mlb is Eastern captive, through Rosatom and Chinese entitlements. 31 Mlb is Western captive, through Japanese entitlements. The remaining 467 Mlb — Kazatomprom's own marketable book plus Orano and Cameco’s entitlement — is contestable, and it is the largest single-country source of contestable supply in the market.
Inspecting Kazakh production more closely, Figure 23 charts each of the fourteen mining entities to the shareholder entitled to the output. Kazatomprom discloses that purchased volumes from its joint ventures "generally correspond to the Company's interest in the respective selling entities." Cameco disclosed receiving its entire Inkai allocation; CGN confirmed receipt at both Ortalyk and Semizbay-U; Russian import data shows uranium entering the Russian system in excess of Uranium One’s full entitlement.
Figure 23, therefore, resolves 67.2 Mlb (all mine output), into the eight holders entitled to it:
- Kazatomprom: 35.2 Mlb — 52%
- Rosatom / Uranium One: 14.3 Mlb — 21%
- Western bloc: 12.0 Mlb — 18% — Orano 4.9 Mlb, Cameco 3.7 Mlb, Japanese entities 3.3 Mlb
- Chinese holders: 5.8 Mlb — 9% — CGN 5.1 Mlb, SNURDC 0.7 Mlb
Next, we followed the pounds out of the country. Kazakh export statistics show where the uranium went, but not whose it was. In Figure 24 we attribute each destination row, as far as the record allows, to the entitlements, sales, and potential swaps behind it — from company reporting, counterparty disclosure and corridor data.
Almost 60 Mlb was exported in 2025. China received 30.1 Mlb — half of everything shipped, against ~9% of the equity. Russia took 19.7 Mlb, 33% against 21% equity. Western destinations took 10.1 Mlb: 17% on 18% of the equity. We would not read that shortfall as pounds lost, since swaps and book transfers at converters mean Western material can be received without being shipped west.
Of roughly 30 Mlb that cannot be tied to JV entitlements, 19 Mlb went to China, 5 Mlb to Russia and 5 Mlb headed West. Our attribution of these pounds allocates Orano's 4.9 Mlb KATCO entitlement to China based on French customs data, company reports and Orano's own statement that its Kazakh production goes primarily to Chinese clients.
The Russian column needs care. EAEU statistics exclude pure transit, so the 19.7 Mlb booked to Russia entered its fuel-cycle system rather than just passing through the region. Kazatomprom disclosures indicate a portion of that 19 Mlb was bought from Kazatomprom’s own book. These pounds entered Russia but were not necessarily Russian-consumed: Rosatom refines uranium and trades it, we judge onward resale of this product likely based on Western agency reporting.
7.2 Mlb of 2025 production, 11%, never appears as a 2025 export at all, most likely reporting convention and book transfers. This does not, however, change the overall shape. More than 80% of Kazakh exports cleared to Russia and China, and a group of customers under common control accounts for almost half of Kazatomprom's own book (by revenue). We infer that this customer is CNNC with high confidence; one of its subsidiary’s own IPO prospectus name Kazatomprom as its largest supplier in H1 2025 with the bulk of Kazakh deliveries entering China towards the end of the year.
Looking beyond 2025, we do not expect the concentration of sales into Asia to diminish. CNUC has repeatedly expanded its contracting relationship with Kazatomprom, most recently in late 2025, and a multi-billion dollar India contract followed in spring 2026. Kazakh production that is available in principle is increasingly being committed through long-duration state relationships rather than held open as swing supply for the West.
Implication for the contestable pool. Half of Kazakhstan's 2025 natural uranium exports went into China with Chinese companies holding less than a tenth of the mine equity. Yussupov's framing of Eastern customers as buyers who plan in decades suggests this volume is not just spot-driven but committed well into the future. Hold that pattern forward — Chinese entities taking roughly half of Kazatomprom's marketable book and the whole of Orano's KATCO output — and about 20% of the contestable pool is bound for China by 2035.
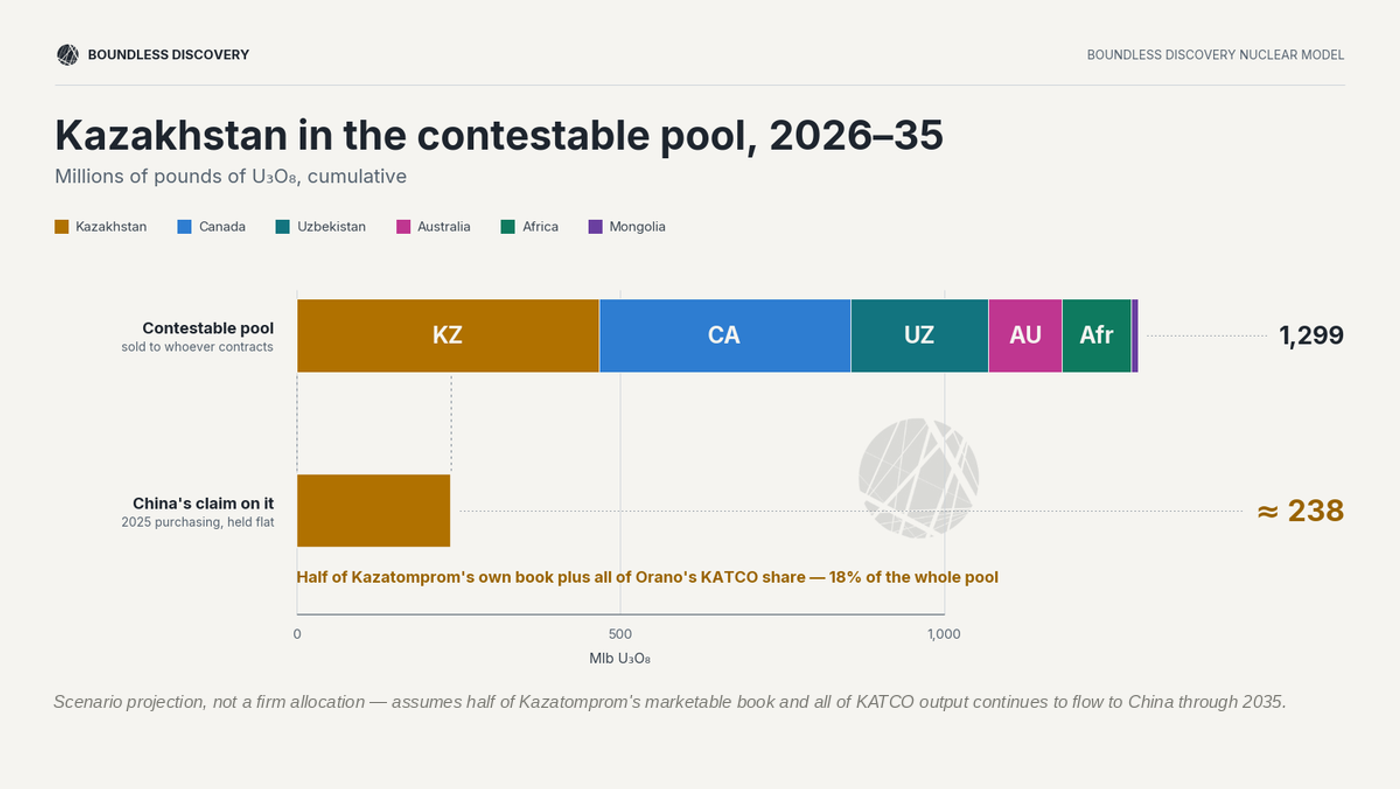
This chart is a scenario projection rather than a certain allocation. But it makes the core finding plain: equity at the mine materially understates how much Kazakh uranium China can actually command.
Beyond the Mine
Kazatomprom’s position is also changing. For two decades, it acted as the market’s principal growth producer, rapidly expanding low-cost output into a broadly global market. It is now placing greater emphasis on supply discipline, sovereign control and the development of a more integrated domestic fuel cycle.
Three developments matter:
- Sovereign Control: Kazakhstan has strengthened the conditions under which foreign partners can extend subsoil-use agreements. Future renewals will increasingly depend on commitments that advance Kazakhstan’s domestic capabilities, including investment, processing technology (conversion and enrichment) or participation elsewhere in the nuclear value chain. This creates leverage over partners whose mine licences approach expiry.
- The expiry of the Akdala deposit’s subsoil-use agreement in March 2026 is an early example. The deposit had previously been operated through a Kazatomprom–Uranium One structure; when the agreement expired, control of the resource returned to the Kazakh state.
- Value over volume: Changes to Kazakhstan’s mineral-extraction tax and Kazatomprom’s own production discipline reduce the incentive to maximise output regardless of market conditions. The producer is increasingly behaving as a disciplined supplier rather than a swing supplier.
This new push for sovereignty is unfolding alongside deeper integration with Eastern nuclear systems. China financed and is a joint-owner of a fuel-fabrication facility at Ulba; Rosatom has been selected to lead Kazakhstan’s first nuclear power plant; and CNNC has been selected for the second. Together with the development of uranium storage and logistics infrastructure near the Chinese border, the direction of Kazakhstan’s future nuclear development increasingly points East.
Not every element points exclusively East and Kazatomprom continue to signpost their diversified customer book. That said, the infrastructure, technology partnerships and largest new state-level contracts increasingly bind Kazakhstan to Eastern sovereigns.
Our full Kazakhstan deep dive will map the whole system - every mine's ownership and licence expiry, fabrication, storage, and the state's ambition for an integrated fuel cycle. Subscribe to get it when it drops.
(b) Africa: Where Financing is Leverage
African uranium production could rise from approximately 24 Mlb in 2026 to 62 Mlb by 2035. Yet Firm production in 2035 remains only around 24 Mlb. Almost all of the potential growth therefore depends on projects that still require substantial financing, construction, and execution.
That makes capital allocation inseparable from uranium allocation. In African uranium mining, the financier frequently secures equity and offtake in the same transaction that moves a deposit towards production (Figure 26).
Part of the operating base is already Eastern captive. CGN controls Husab, while CNNC controls Rössing. The next generation of projects is being allocated through financing.
At Etango, China National Uranium Limited has agreed to invest up to US$321.5 million for a 42.75% interest and rights to 60% of life-of-mine production. Bannerman will retain majority ownership, but only 40% of production remains outside the Chinese offtake. Chinese capital will likely, therefore, convert a nominally Western-controlled development project into majority Chinese-secured supply before FID.
Niger demonstrates a different route through which Western access can disappear. Since the 2023 coup, the state has revoked Orano’s Imouraren permit and moved to nationalise SOMAÏR, while millions of pounds of Orano-linked uranium have remained stranded in the country. Production that once appeared embedded in the Western fuel system can no longer be treated as reliably accessible.
The recurring pattern is that China did not need to discover these deposits. It financed them, acquired them, or recapitalised their owners when other sources of capital withdrew.
- CNNC developed Azelik (a deposit discovered by French geologists in 1957) through a Chinese-led joint venture with the Nigerien state.
- CGN acquired Extract Resources - and with it Husab - for roughly US$2.1–2.4 billion during the post-Fukushima downturn, supported by a US$2.1 billion China Development Bank loan package, before financing the mine’s construction.
- A CNNC subsidiary injected US$190 million into a financially stretched Paladin in return for 25% equity in Langer Heinrich as well as the right to purchase its corresponding share of production.
- Rio Tinto sold its 68.62% interest in Rössing to CNUC for only US$6.5 million upfront, although the agreement included up to a further US$100 million contingent on uranium prices and mine profitability.
In each case, the exchange was similar: capital and execution support in return for ownership and long-term access to pounds.
Etango indicates that this model is moving earlier in the project cycle. Chinese entities are no longer only acquiring operating or distressed mines; they are financing pre-production projects and securing their output before construction.
Implication for the contestable pool. Most of Africa’s potential production growth requires a financier. To date, Chinese entities have been the most consistent source of large-scale strategic capital, and their investments have generally been accompanied by equity, offtake or both.
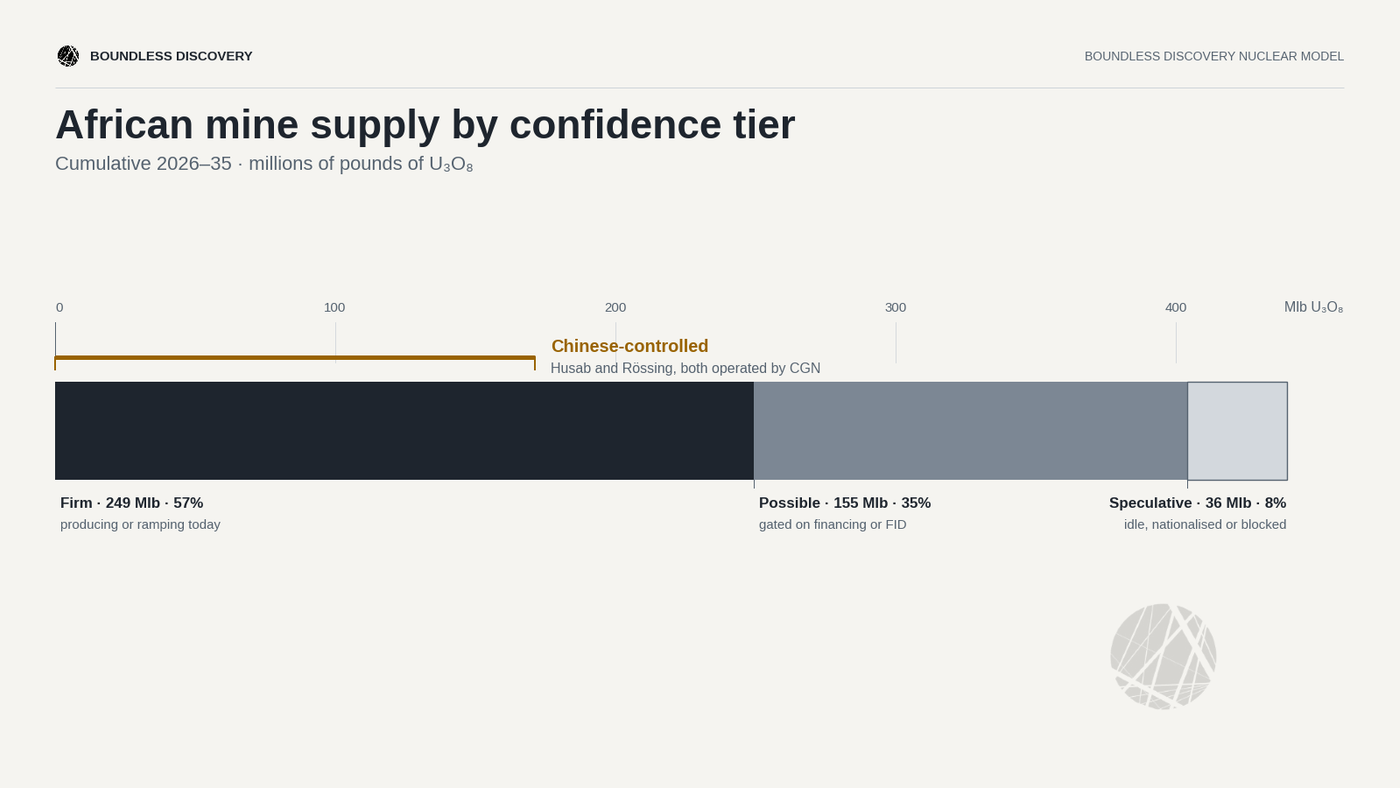
If African uranium is to provide substantial new supply for Western buyers, Western capital will need to fund projects before Chinese financing has already allocated their production.
We will be releasing a Deep dive on African Mining soon. Subscribe to get it sent straight to your email.
(c) Uzbekistan: The Open Book, Closing
Uzbekistan is one of the few producers materially outperforming market expectations. That makes it the clearest real-time example of a growing contestable supply book being claimed.
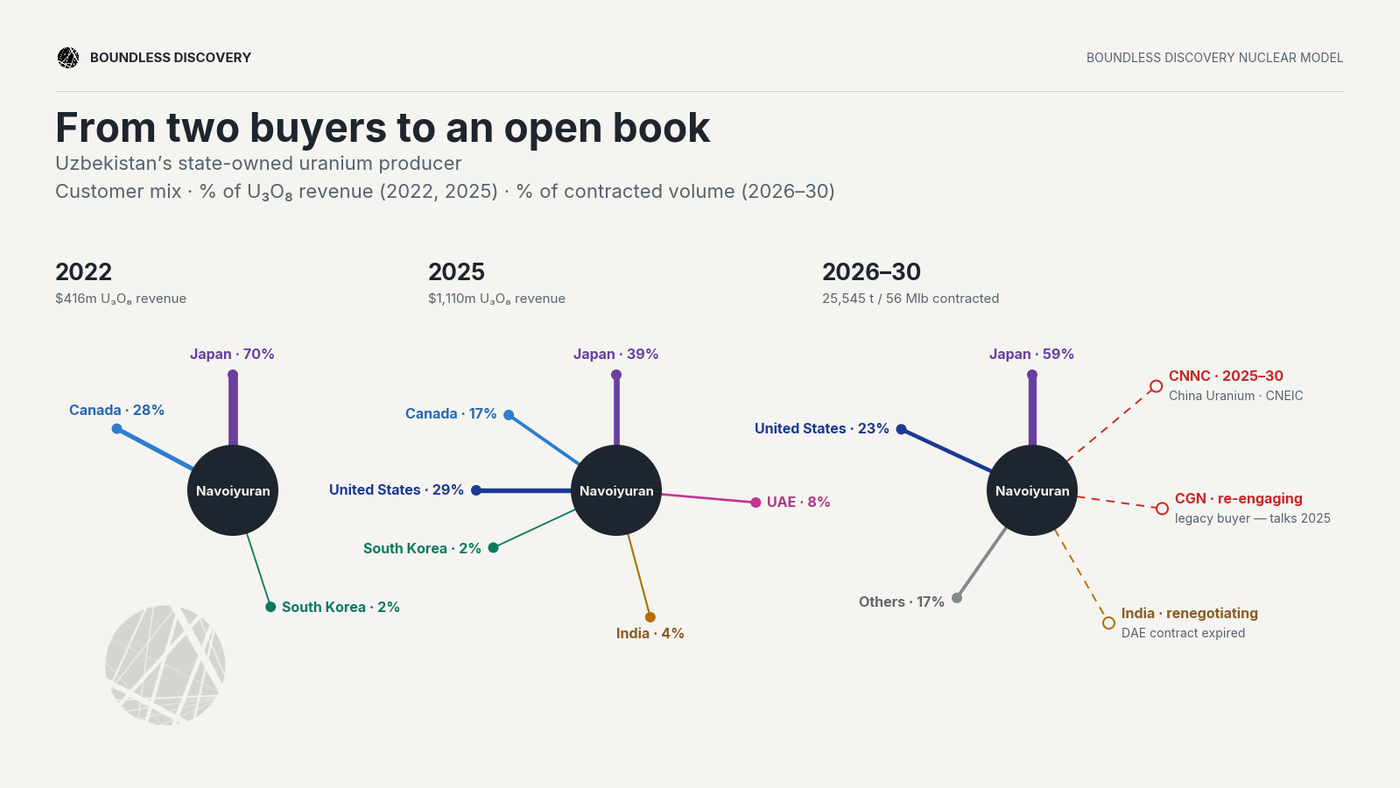
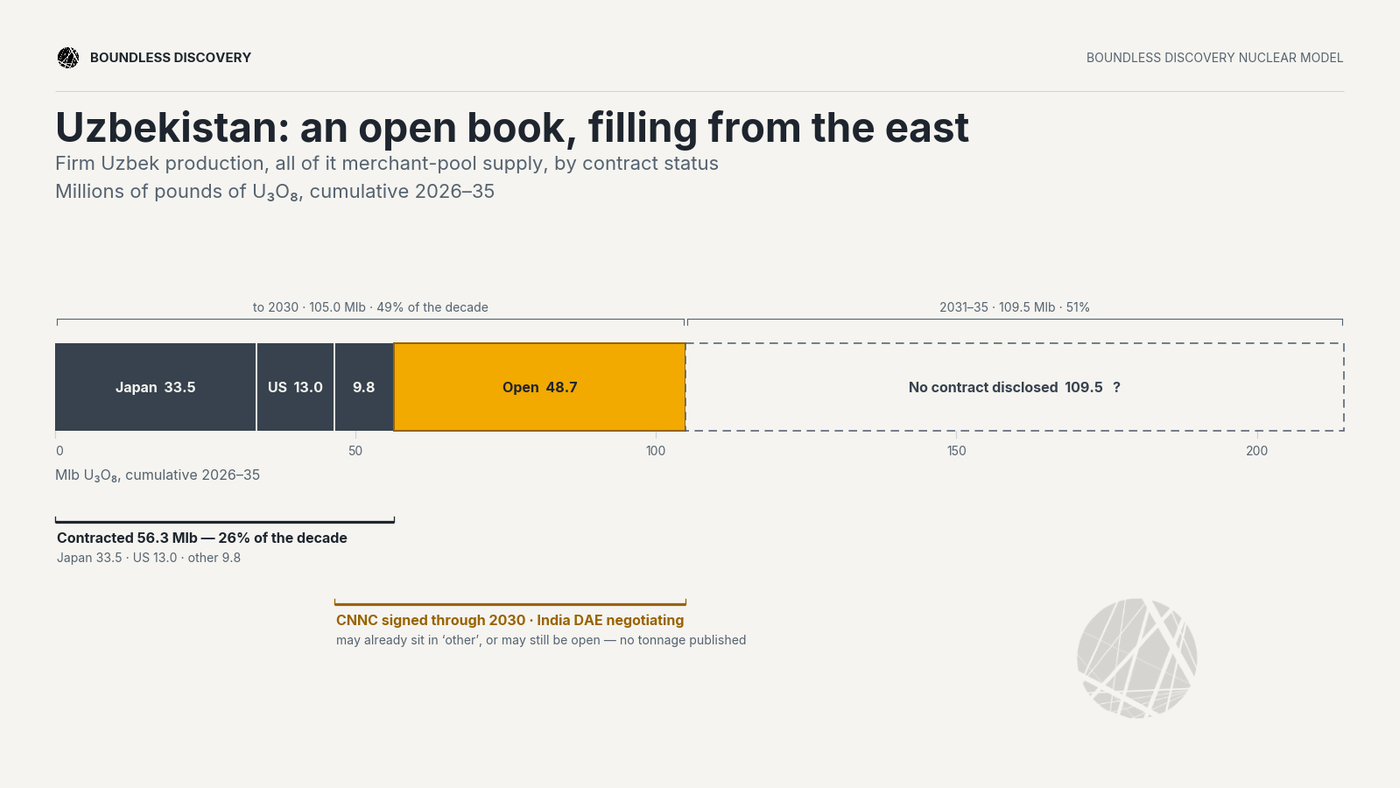
State-owned miner Navoiyuran produced approximately 18 Mlb in 2025, well above the roughly 11 Mlb that had been expected in many external forecasts. Four additional mines are scheduled to begin production in 2026, while the state’s nominal output target remains approximately 18.7 Mlb. Recent performance suggests that this target may represent a floor rather than a ceiling.
Unlike much of the prospective mine pipeline, these are ‘Firm’ near-term pounds from an operating state producer. A meaningful share of planned output was still not tied to publicly disclosed long-term commitments at the end of 2025.
Japan entered early and holds long-term offtake relationships. US utilities also have disclosed supply exposure. Together, these commitments mean part of Uzbekistan’s output is already directed into Western and Japanese fuel systems.
The remaining open book is being contested now China’s CNEIC has signed a supply agreement running through 2030. CGN has held discussions on deeper mining cooperation with Navoiyuran. Indian parliamentary disclosures have confirmed negotiations over additional uranium purchases.
India-Uzbekistan Negotiations (March 2026)
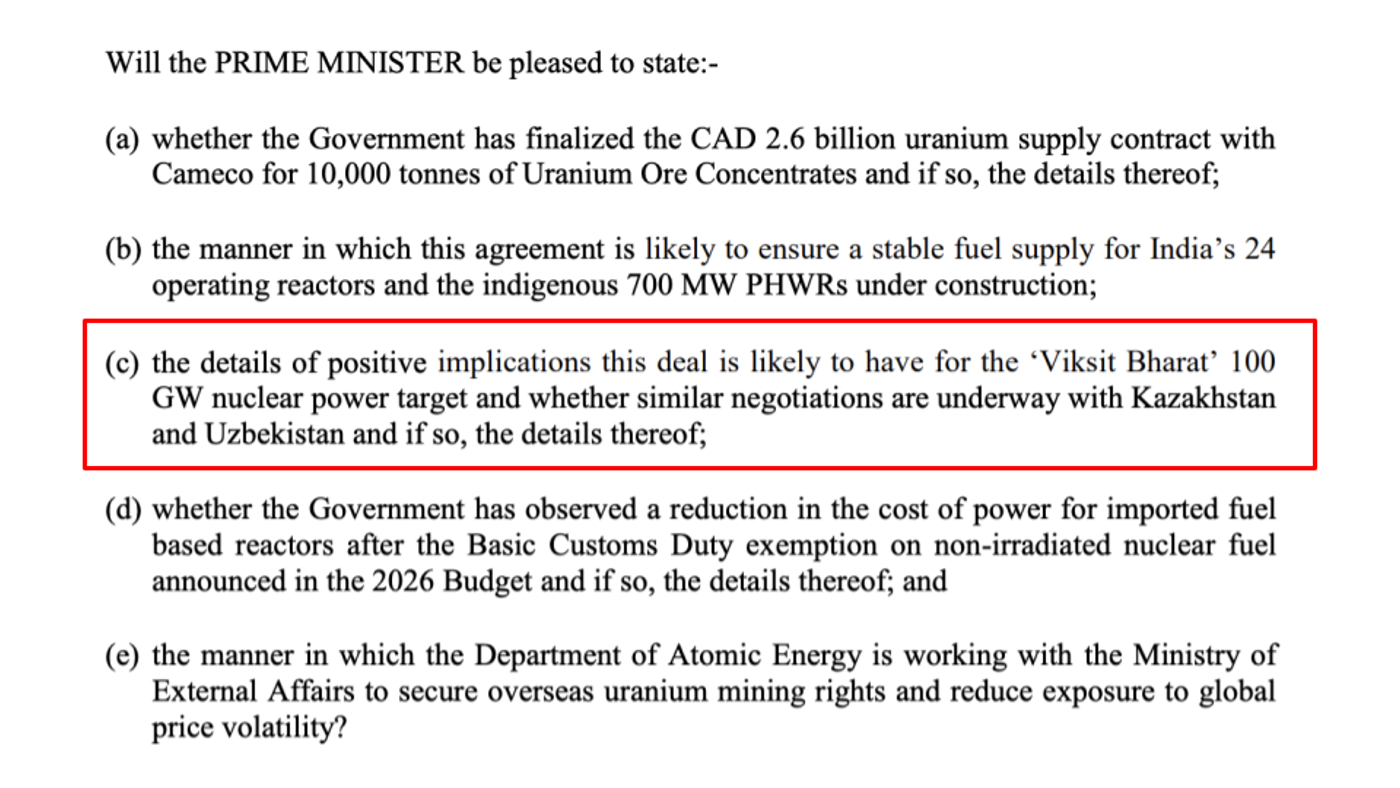
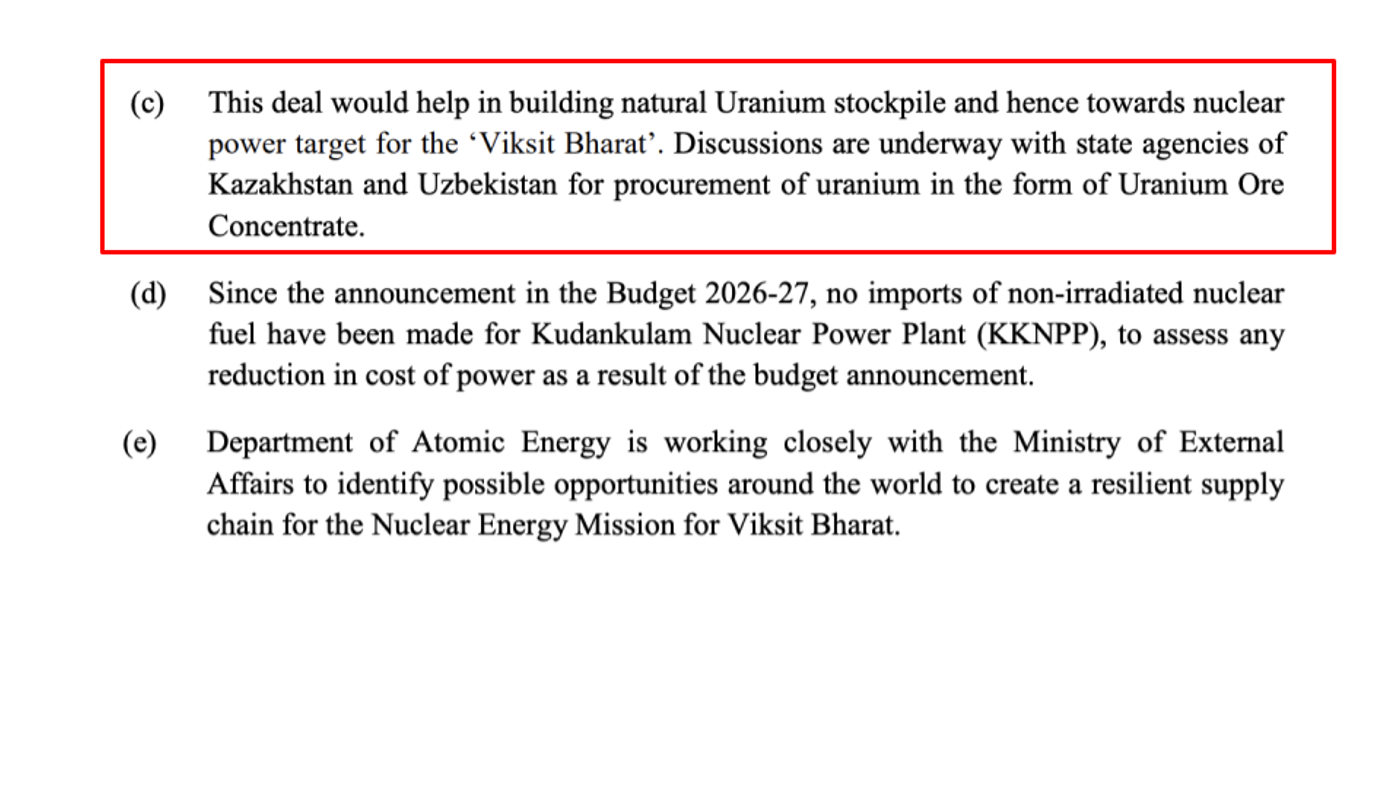
Implication for the contestable pool. Uzbekistan is the clearest case in which participation still wins pounds. Buyers that establish state-level relationships, offer long-duration contracts or support production growth can secure material from an expanding book. Buyers that wait do not preserve optionality; they allow someone else to claim it.
(d) Canada: The Western pool is not Protected
Canada is the West’s largest source of geopolitically aligned uranium production. Its pounds, however, are not reserved exclusively for Western buyers.
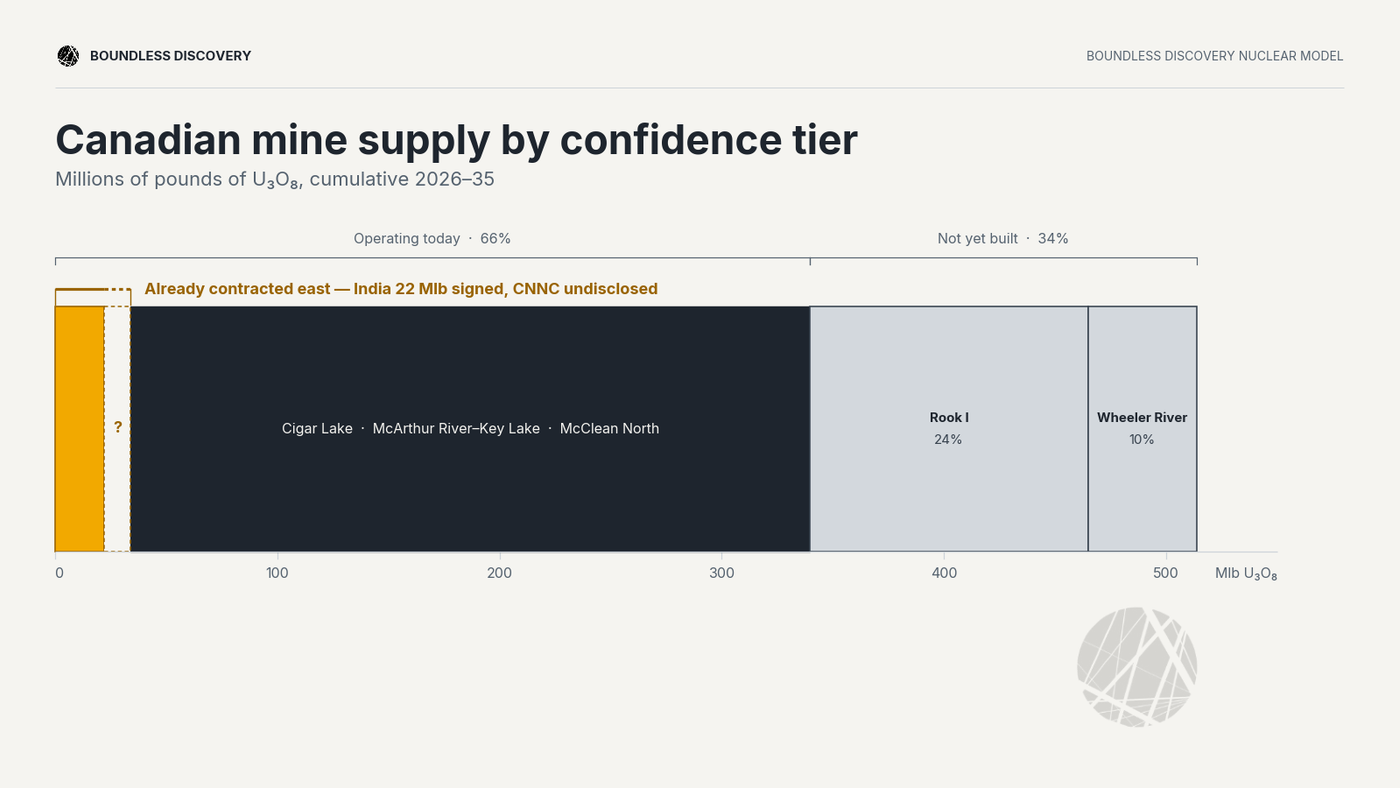
Cameco’s new agreement with India commits nearly 22 Mlb for delivery between 2027 and 2035, with an estimated value of C$2.6 billion. China is also already present in Cameco’s order book. The company signed supply agreements with CNNC’s China Nuclear International in 2022 and 2023, although delivery volumes and timing remain undisclosed.
The broader state-level relationship has also reopened. During Canadian Prime Minister Mark Carney’s January 2026 visit to Beijing, Canada and China committed to strengthening trade in natural uranium, providing a diplomatic channel through which further procurement could occur.
At the same time, Canadian production is not automatically expanding in response to higher prices. Cameco is pacing output at McArthur River against contracted demand rather than producing at maximum licensed capacity. This is commercially rational supply discipline, but it means apparent spare capacity is not equivalent to immediately available supply.
NexGen’s Rook I project presents the opposite risk. At approximately 29 Mlb per year at full production, it is the single largest new source in our Probable supply stack. NexGen has already contracted some future deliveries beginning before our expected production window. The company therefore carries both construction risk and delivery obligations.
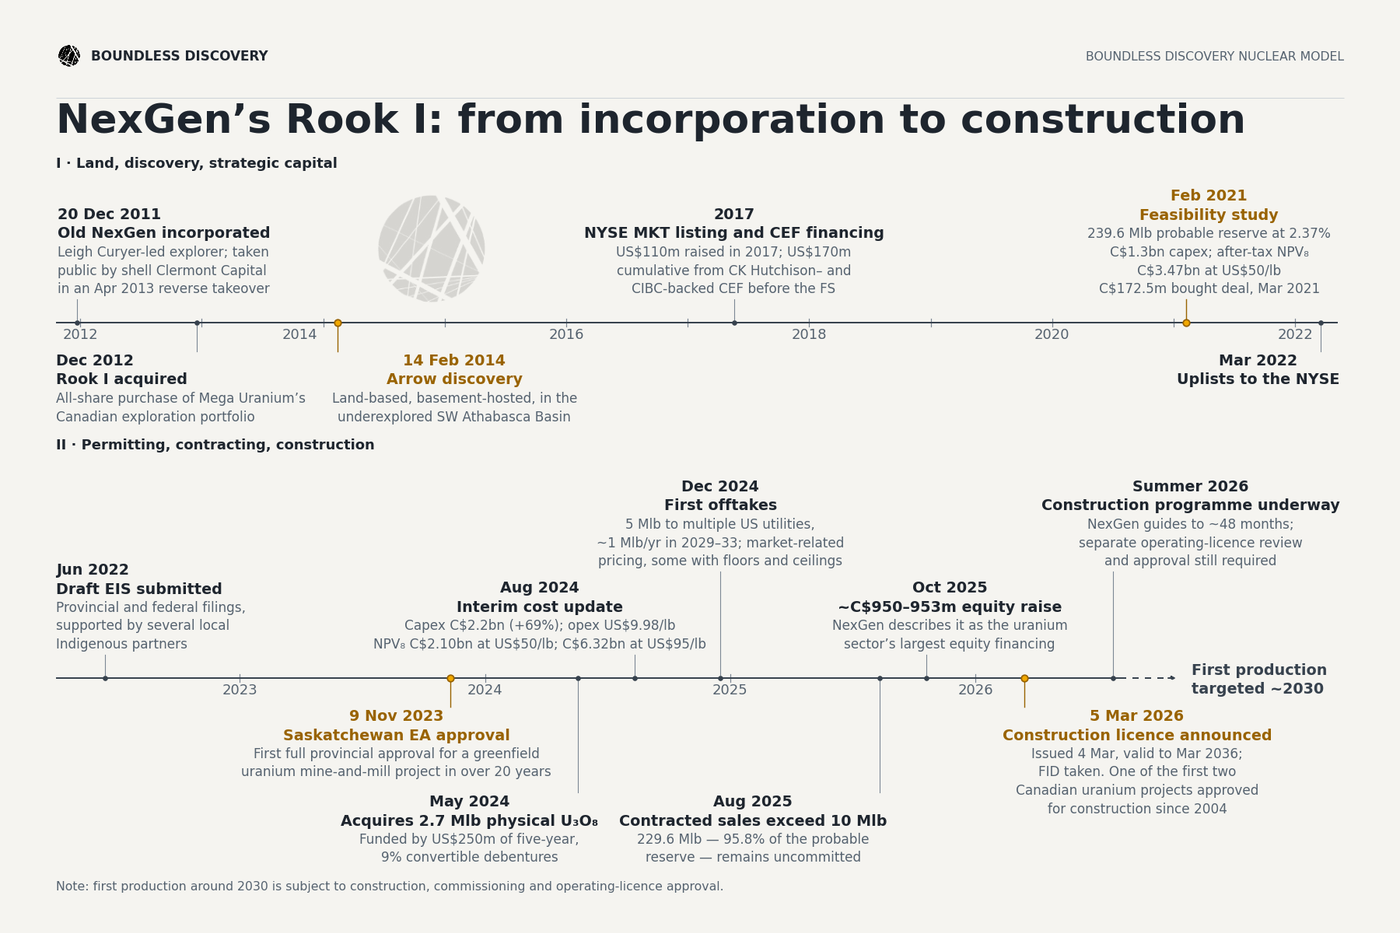
With limited inventory and first production dependent on construction and ramp-up execution, any further delay could force either NexGen or its customers to seek replacement pounds in the market.
Implication for the contestable pool. Canadian production is squeezed from both directions. Incumbent pounds are being contracted by sovereign buyers years in advance, while the largest prospective source is already supporting future delivery commitments before it has entered production.
(e) Australia: Geology vs. Policy
Australia holds the market’s largest geological escape route for rising uranium demand, but much of it remains hindered by state bans, policy restrictions and projects that have never reached construction.
Current production is concentrated in South Australia. Major deposits in Western Australia remain delayed or stalled, while New South Wales, Queensland and Victoria continue to restrict uranium mining (Figure 34).
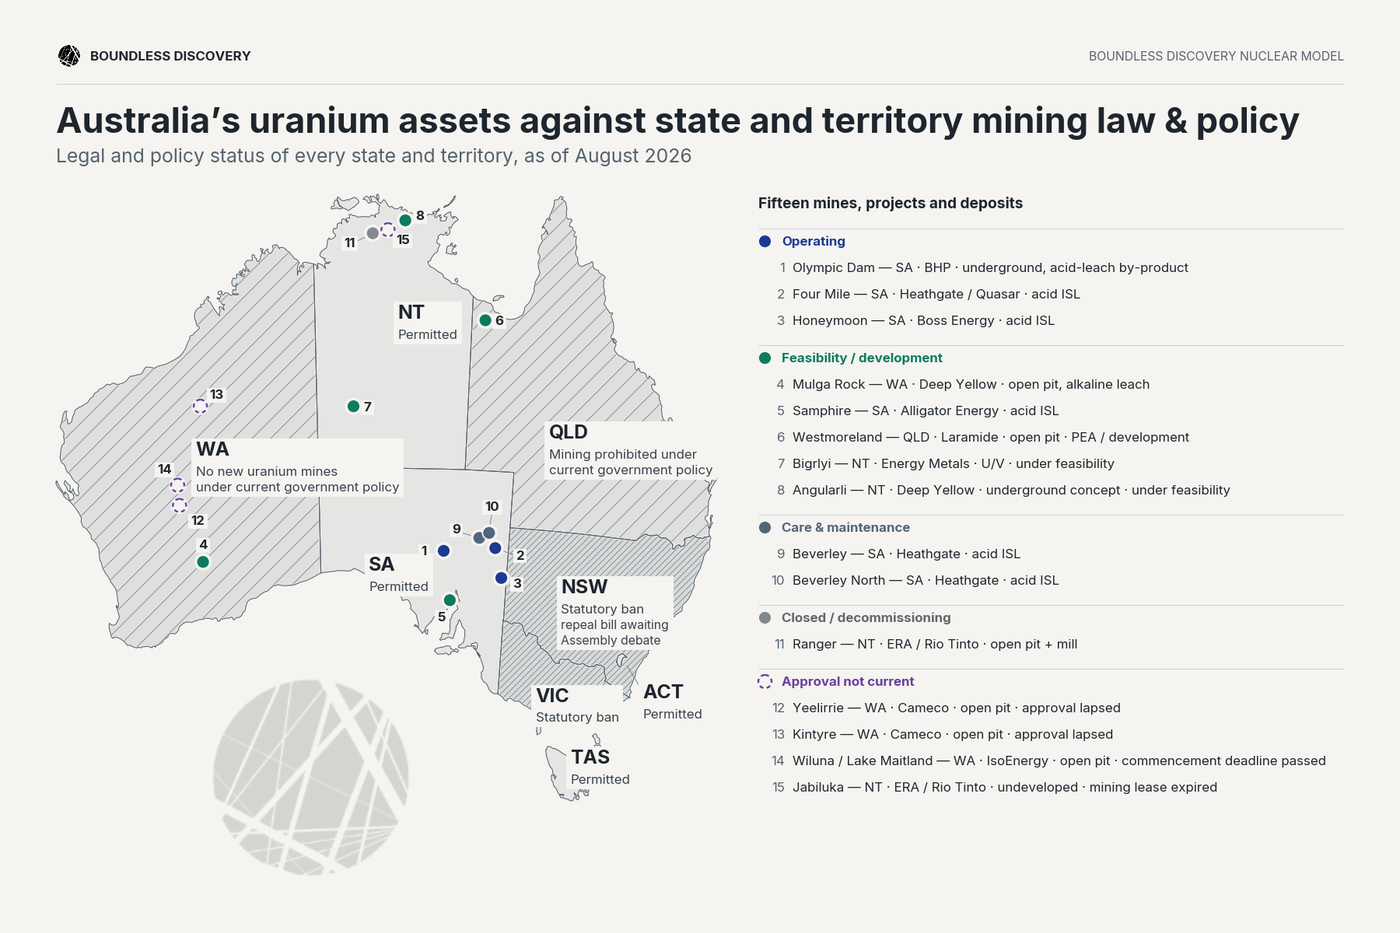
The export gate is also opening faster than the mine gate. In July 2026, Australia and India completed the administrative arrangement required to enable long-term Australian uranium exports under IAEA safeguards. No major supply contract has yet been announced, but any future Australian production can now be contested by India alongside China and Western utilities.
Australia, therefore, illustrates the difference between resources and responsive supply. The uranium exists, but converting it into contestable pounds requires policy change, financing, construction and contracts. By the time those projects are ready, the buyers competing for them will likely include every major nuclear growth market.
(f) India’s Next Step: From Contracts to Control
India’s domestic uranium production is minimal relative to both its existing requirements and its long-term nuclear ambitions. Its response is beginning to extend beyond supply contracts towards direct ownership of overseas resources.
In 2026, state-controlled NTPC commissioned advisers to identify international uranium assets and conduct due diligence on as many as five targets. The search included Australia, Canada, Kazakhstan, South Africa and other uranium-producing jurisdictions (Figure 35).
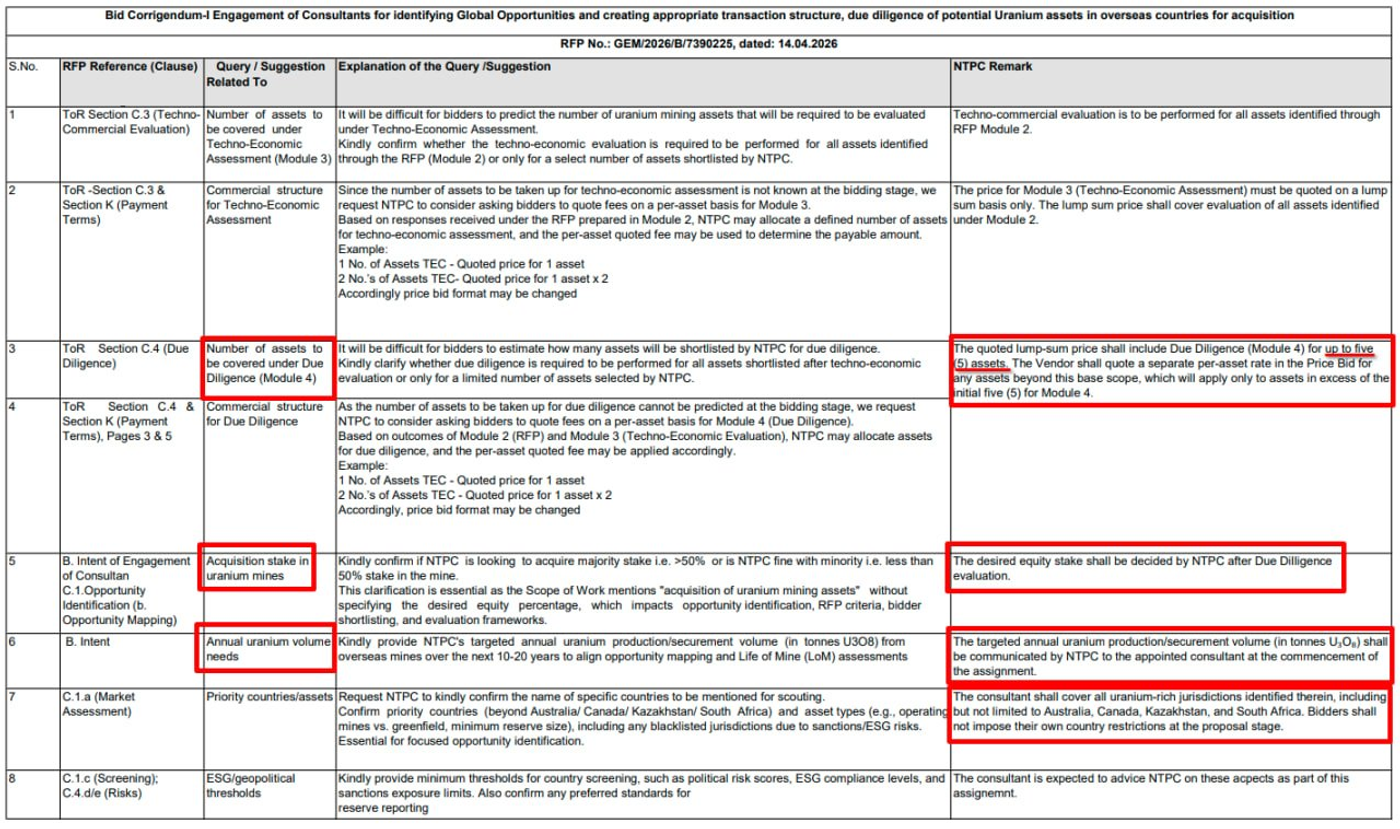
This remains an acquisition programme rather than a completed transaction. But it should be viewed alongside India’s approximately 22 Mlb Cameco contract, its multibillion-dollar agreement with Kazakhstan, its negotiations with Uzbekistan and the opening of an Australian uranium trade route.
India is not yet a uranium buyer on China’s scale. Its current fleet creates a much smaller demand pull. The importance lies in the direction and timing of its procurement: India is beginning to secure supply against the fleet it intends to build, rather than waiting for that demand to materialise.
Its 100 GW target by 2047 is uncertain and will almost certainly encounter delays. But India does not need to achieve the target in full for its procurement to affect the market. Even partial execution would make it a substantially larger buyer, and its state-backed institutions are already moving ahead of that requirement.
______
Across all of these markets, the same pattern holds: contestable pounds bind to the strongest package of price, volume, duration, and financing. State-backed buyers can offer all four at scale while US utilities usually contract one book at a time looking to minimise their costs.
- Kazakhstan shows the bulk of existing production moving east;
- Africa shows future production being allocated East at the financing stage;
- Uzbekistan shows the East arriving at a contestable growing supplier;
- Canada and Australia show that Western geopolitical alignment is far from a guarantee of Western access;
- India shows a new sovereign with big ambitions moving early on contracts and progressing towards ownership of mines abroad.
All of these transactions make perfect commercial sense. In aggregate, however, they convert apparently contestable production into supply secured for a particular selection of Eastern state-backed programmes.
3.5 The Membrane Extends Beyond the Mine Gate
Mine output is only the first stage of the nuclear fuel cycle. Conversion, enrichment, and fabrication all have their own industrial bottlenecks, commercial structure, and geopolitical constraints. We will examine the full downstream fuel cycle in separate write-ups. Here, we focus on enrichment because it is where today's geopolitical divide most clearly alters demand for yellowcake itself.
The merchant enrichment market is concentrated in Urenco, Orano, Rosatom, and CNNC, all state-owned. Russia and China hold materially more capacity than the West (Figure 36), while US and UK restrictions are removing Russian supply faster than Western plants can replace it. The EU will likely remain connected to Russian enrichment because replacement capacity is not yet available elsewhere.
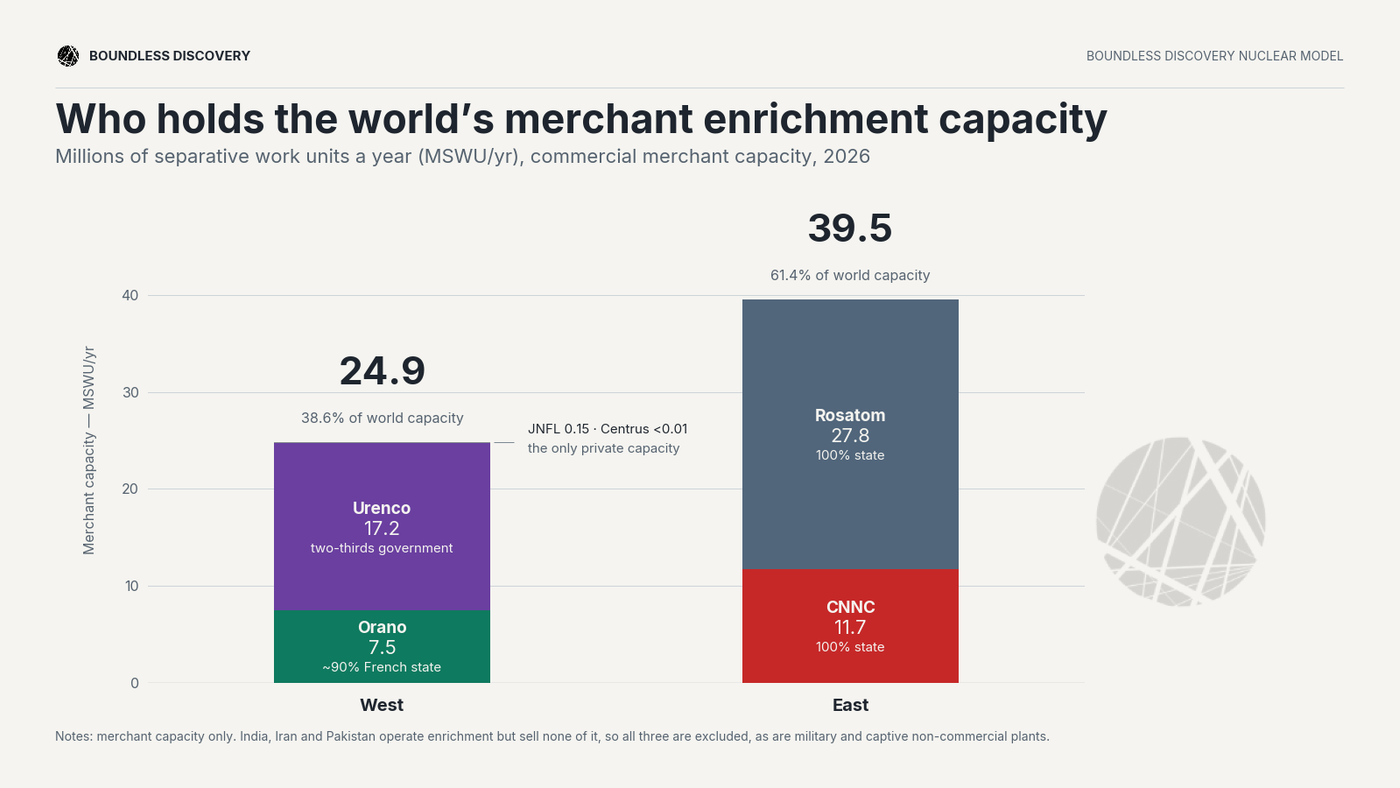
During the Cold War, the United States enrichment capacity peaked at 27m SWU/year. Since then it has shrunk to 4.8m SWU/year. The US will continue to be dependent on imported enrichment services through much of the coming decade. Even under announced expansion plans and greenfield facilities, Western capacity struggles to meet projected base case demand before the early 2030s. China, by contrast, is already self-sufficient in enrichment. It continues importing Russian enriched uranium not through necessity but because an additional supply buffer is both commercially and strategically rational.
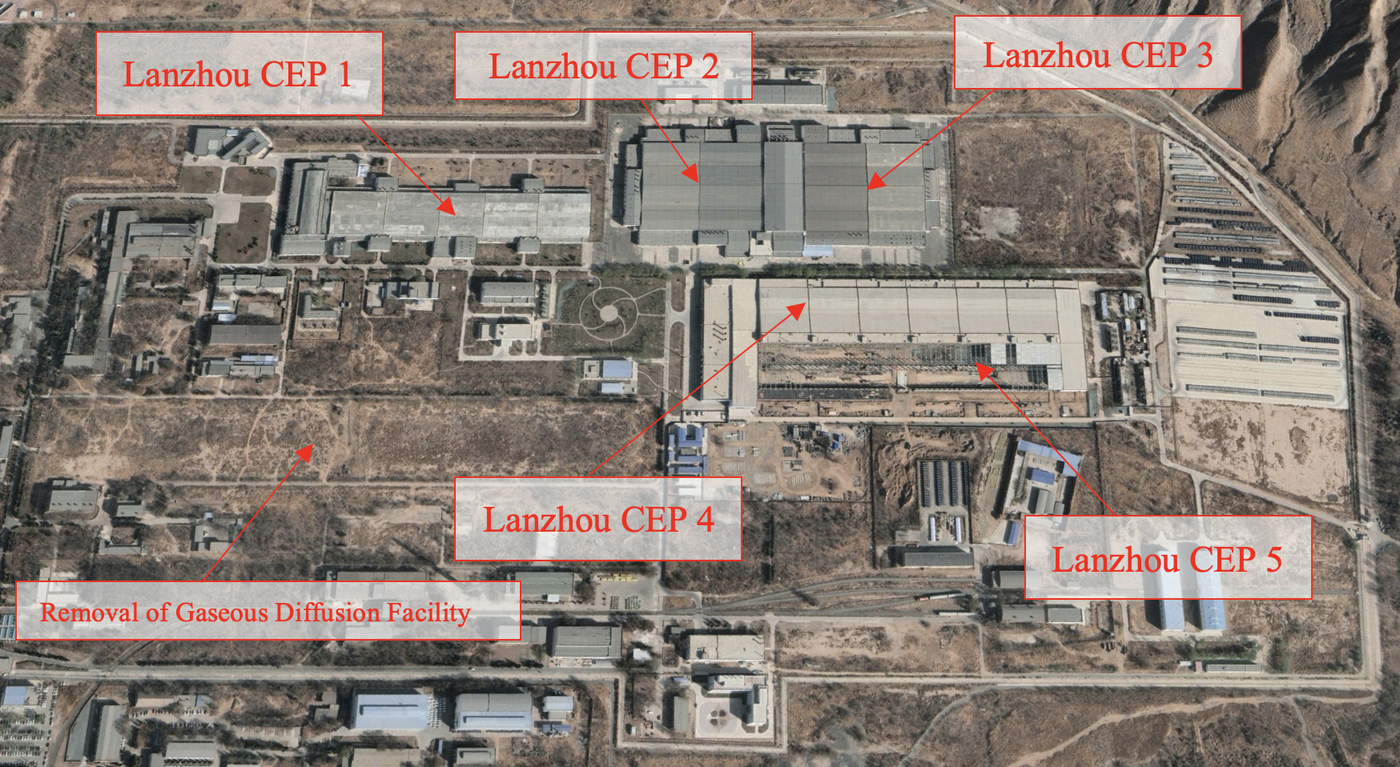
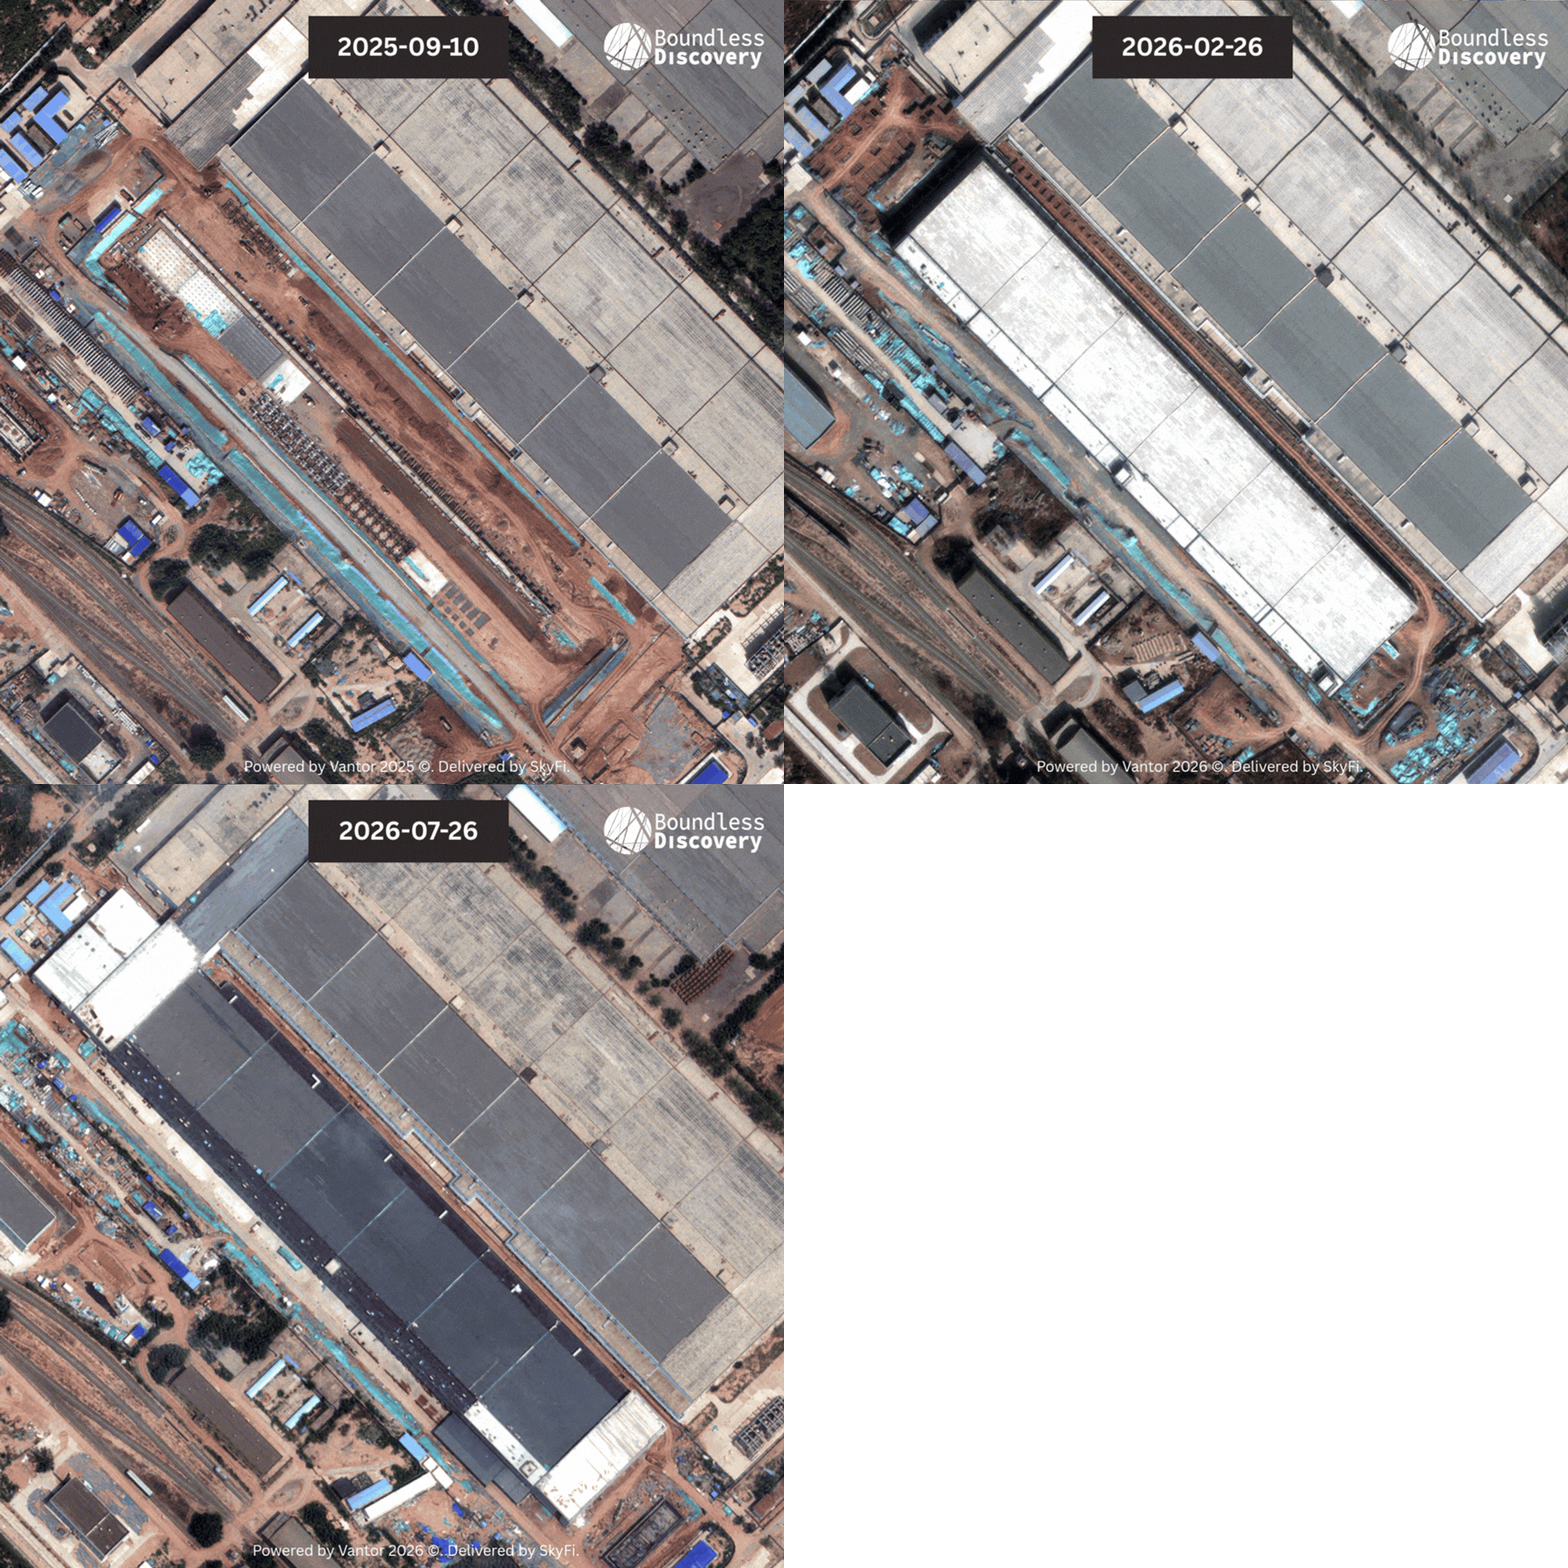
Although China discloses very little about its enrichment programme, our analysis of satellite imagery shows a sixth new enrichment cascade hall added at Lanzhou enrichment plant in 2025, providing physical evidence of continued capacity expansion beyond what little can be gleaned from official disclosures. Figure 37 shows the facility in 2023 when the construction of a fifth centrifuge enrichment plant (CEP) was underway, while Figure 38 reveals what appears to be the completion of CEP 6 over the past year.
The significance is not that the fuel cycle has already split cleanly into two blocs. It is that the direction of travel is increasingly asymmetric. Russia already controls a complete fuel system while China is steadily expanding one. Meanwhile, the West, acutely aware of its dependencies, is rebuilding capacity which it has allowed to atrophy.
The membrane determines not only who can secure uranium, but increasingly who can convert it into reactor fuel without relying on a strategic competitor. China could theoretically sell any excess enriched uranium produced domestically, or even low-cost enriched uranium imported from Russia, to Western markets where enrichment capacity is struggling to meet expanding demand.
As companies like Centrus, Orano, and Urenco invest billions in both brown- and greenfield expansions, China could eventually sell large quantities of enriched uranium to the West, undercutting Western providers at prices they are unable to match creating economic instability. This is a hypothetical scenario but a familiar playbook which China have deployed in other strategic minerals.
Part 4: Implications of a Bifurcated Shortage
4.1 What We Found
Primary supply and demand almost balances: 2,264 Mlb demand against 2,123 Mlb of Firm and Probable supply from 2026-35. Accounting for the confluence of Western forced overfeeding due to enrichment constraints, strongly evidenced stockpiling by sovereigns such as China and India, the West has an uphill battle to secure remaining available pounds.
Two charts from this memo distill the story. Figure 39 illustrates the extent to which US utilities are materially uncovered in the 2030s. Figure 40 shows that these requirements join every other claim on just 1,299 Mlb of contestable supply over the decade. Net claims on the contestable pool — reactor requirements not met by captive supply — already exceed it by 141 Mlb. Recent evidence overwhelmingly points to a continuation of Eastern yellowcake purchasing above their requirements and ahead of US utilities in line for the contestable pool. Adding Chinese stockpiling at a quarter above its own reactor requirements alone (2020-25 average was 42% above requirements) takes the shortage to 291 Mlb; financial demand at 5 Mlb per year widens the deficit to 341 Mlb.
Secondary supply can bridge part of that gap, but not without signalling to the market that the price of uranium must rise significantly. Secondary supply is also not a fungible pool. Russian underfeeding and Chinese stockpiles are not automatically available to Western utilities. If pounds do release from these sources, they will likely come at a very high price both monetarily and geopolitically.
There is a further asymmetry in how sovereigns buy. A stockpile is a requirement of inelastic demand and energy security: every incumbent nuclear power - the US, Japan, Korea, France - built one. The new entrants intend to be leaders, so China and India will not procure for consumption; they will procure to consumption plus reserve, for as long as it takes to acquire one.
Western utilities, meanwhile, may treat their existing inventories as a reason to defer contracting. Both sides are behaving rationally, and the combined effect is a one-way transfer: the East adds to its stockpiles out of the merchant pool while the West runs its down.
Inventory is also not protection here, it is what makes the deferral feasible and ultimately more painful. Term contracts are the demand signal which facilitate mine financing. Every year that the West defers contracting is another year that the supply it will need in the 2030s goes unbuilt. By the time Western utilities return to buy what they have burned they will face a new reality:
- Most of the contestable pool will already have been allocated - deferral in this market only exacerbates the problem;
- The largest holder of surplus pounds is a geopolitical adversary with a long history of using critical minerals as leverage;
- and the mines that could have answered their needs are still waiting on the contracts that would have built them.
4.2 What This Means
- The US is the largest residual buyer: State-backed programmes are prudently front-running US utilities in a tight market backed by concrete national programmes that will easily eat up any extra yellowcake they buy over the next decade.
- The Western nuclear renaissance would come at a cost: All of this assumes the Western nuclear renaissance largely disappoints relative to policy targets and that SMRs remain immaterial before the mid-2030s. If policy converts, Western demand rises will place compounding pressure across the Western fuel cycle.
- The membrane gives the East optionality: If China’s stockpiling continues, they could eventually release uranium back into the global pool, or not. Either way they will hold leverage over the United States.
- Other Western Countries do not have excess surplus: Allied states - France, Japan, Korea - are better positioned with contracts and stockpiles but also have their own ambitions to expand nuclear. They are unlikely to release pounds to the US en masse.
4.3 What could break the membrane shortage thesis
- A nuclear accident. The demand collapse event that has broken previous cycles.
- China stops buying. The East’s biggest buyer decides to draw down its reserve to fuel its buildout.
- China exports heavily to the West. Plausibly swapping natural uranium against Russian-origin enriched uranium.
- The Russia–Ukraine war ends soon and restrictions ease. Much of the relevant 2030s uranium and enrichment book is already contracted, so restored access would add marginal flexibility rather than recreate the old fungible market.
- A US–Kazakh JV. If a US consortium steps into Kazakhstan or the administration signs a state-level agreement at the hinge producer.
- Canada and Australia streamline. Permitting and consent — an institutional change which would still not alter the geological reality of building a mine.
- India backs off on its targets. Removing a large share of the Eastern claim.
- Probable and pre-FID mines outperform. This would rebuild the cushion the model says isn't there.
- A Western unitary buyer emerges: If the US or another state/multi-state coalition begins contracting uranium at scale, it would tighten the near-term market by concentrating demand in one bulk order. But it could also provide the price signal required to finance new supply and weaken the shortage in the 2030s.
The insights in this report are derived from the Boundless Discovery Nuclear Intelligence model, a continuously updated map of the nuclear value chain that recalibrates based on real-world evidence as it emerges. What we're watching closely, however, we reserve for ourselves and our clients.
———
Uranium is not inherently short in the abstract but the pool that remains open to Western buyers is shrinking due to an unprecedented wave of nuclear mobilisation in the East.
The market still appears to be pricing geology and aggregate production. It should be pricing access, timing, and competition from state-backed buyers. Demand is fixed with large upside, supply is slow, and the contestable merchant pool is shrinking long before the shortage appears. We believe this will leave the US scrambling for pounds which lie further up the price curve or in mines scrambling to hit first production.
That is the central implication: uranium prices need to rise - and remain high enough - to finance new mines and persuade holders of uncommitted pounds to sell. Until then, the marginal US utility is exposed.